
Technically Speaking
The Loch Ness Monster, Big Foot, and Bullish Corn

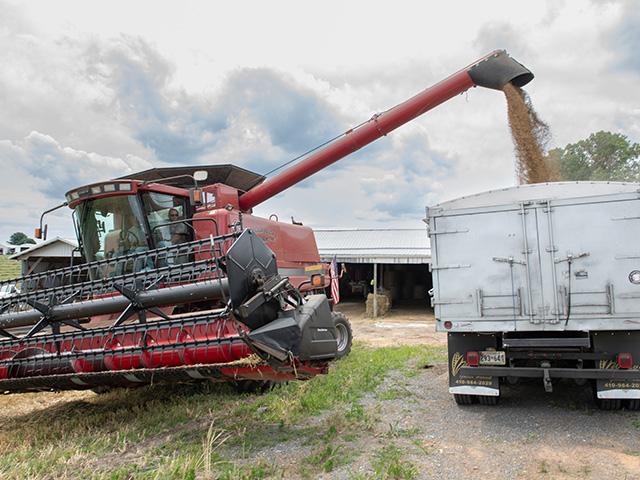
If you thought the new-crop December contract was on a one-way track to $0, you probably weren't alone. Fundamentally, projections for new-crop ending stocks would take corn back more than a decade, back to the stone-age before ethanol's demand market. Last week's quarterly stocks and acreage numbers only added to the bearish pain created by ongoing warm, wet weather over much of the U.S. growing area.
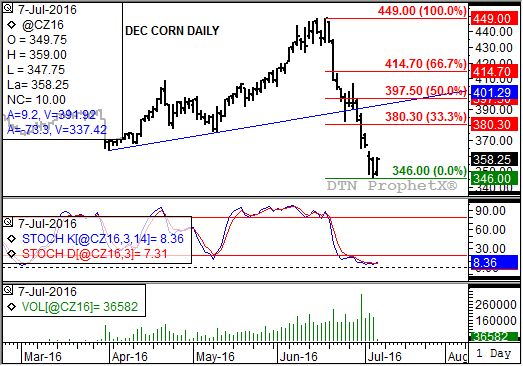
Amidst all this fundamental bearishness though, December corn's daily chart is showing signs of bullish life. Note the rally off Wednesday's low of $3.46, a price more than $1.00 off the $4.49 high posted Friday, June 17. This has daily stochastics (middle study) in position for a bullish crossover (faster moving blue line crossing above slower moving red line) below the oversold level of 20%. If this occurs it would be an early signal of a changed minor (short-term) trend.
As they say on infomercials though, "But wait, there's more!"
P[L1] D[0x0] M[300x250] OOP[F] ADUNIT[] T[]
There is a possible exhaustion gap between the July 1 low of $3.65 3/4 and the July 5 high of $3.63. If Dec corn doesn't fill that gap Thursday, yet closes near its session high, it would be poised to establish an island reversal pattern. This would also signal that the minor trend has turned up.
If all this plays out, meaning noncommercial traders start buying against bearish weather forecasts, how far might Dec corn recover from its $1-plus fall? Thursday morning finds the December-to-March futures spread with a carry of 9 1/4 cents, covering roughly 52% of full commercial carry (total cost of storage and interest to hold the grain in a commercial facility). This would be viewed as a neutral read on new-crop supply and demand, putting the maximum retracement target at 50% of the previous sell-off.
Let's look back at Dec corn's daily chart. The 50% retracement market of the previous downtrend from $4.49 to $3.46 is $3.97 1/2. However, before the contract can even think of stretching that far it has to find a way back to the 33% retracement level of $3.80.
One way to monitor the interest in the rally is to watch daily volume (number of contracts traded, bottom study). If daily volume on days the contract rallies is less than days it sells off, it’s a technically bearish signal that noncommercial (fund, investment, etc.) traders are all that interested in pushing the market higher. Even if we discount the spike volume of roughly 318,000 contracts on June 30 (USDA report day), activity still needs to climb to about 200,000 contracts daily to be bullish.
It should also be noted that Dec corn, as the more active contract registering on continuous charts, is holding above secondary (intermediate-term) support near $3.53 1/2 (weekly close chart) and $3.50 1/4 (continuous monthly chart).
Stay tuned to DTN for updates.
To track my thoughts on the markets throughout the day, follow me on Twitter: www.twitter.com\DarinNewsom
Comments
To comment, please Log In or Join our Community .