

Technically Speaking
Focusing on the Forest

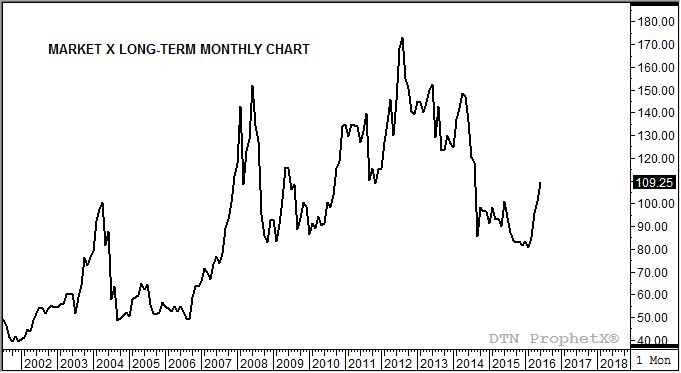
I need your help with this one. Decades ago when I was one of many young commodity brokers with a particular company in Wichita, Kansas, the owner would occasionally test us on our ability to read markets. He would hand us printed charts (daily, weekly, or monthly) of a variety of commodities after removing any clue as to what market they were for. That removed any fundamental bias we might have that could cloud our technical reading. From there we were expected to provide a conclusion as to a market's bullishness, bearishness, or neutrality as well as project where it might be headed.
Fun days indeed.
But there was some logic to it as well. Sometimes, particularly when markets see increased volatility due to headlines changing the fundamental perception on a daily basis (e.g. weather markets in grains), it's better to focus on the big picture rather than day-to-day mood swings of traders. To that end I present to you a monthly close only chart of Commodity X, in hopes of providing as clear a view of the forest for you as possible.
P[L1] D[0x0] M[300x250] OOP[F] ADUNIT[] T[]
Now, what do you see?
First, there are no wrong answers. For everyone who sees a continued downtrend there will likely be someone who sees an uptrend. And for everyone who thinks the market is going back to 40.00, there will be just as many (possibly) thinking it's going back to 140.00.
Feel free to post your analysis/comments in the space on this blog, or tweet them to me on the social media site Twitter. If you are so inclined, feel free to guess at what market is represented by the chart.
I'll post an update on what this chart is telling me either later Monday or early Tuesday, depending on the feedback it generates.
Looking forward to seeing your response.
Stay tuned.
To track my thoughts on the markets throughout the day, follow me on Twitter: www.twitter.com\DarinNewsom
Comments
To comment, please Log In or Join our Community .