

Technically Speaking
And Market X Is...
First let me say "Thank you" for all the participation in Monday's blog. There are a number of good technical analysts out there that saw a number of patterns that I look for as well. Responses touched on basic trendline support and resistance to the slightly more complex Elliott Wave theory. Others noted volatility as the list of possible markets started to be trimmed to something in the global oilseed complex.
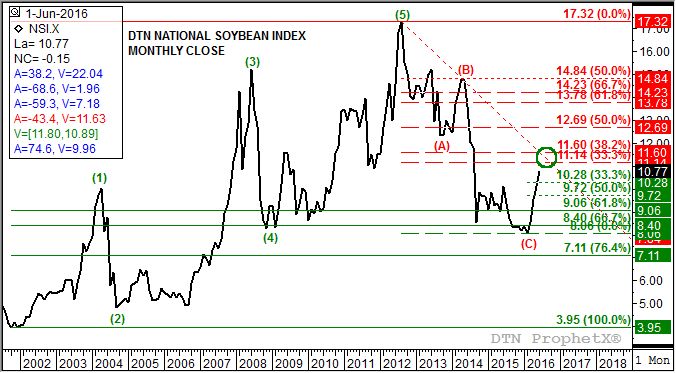
In fact Market X was the DTN National Soybean Index (NSI.X), its value multiplied by 10 to provide a disguise. It remains one of my favorite charts because one doesn't have to know the underlying fundamentals to see what the market is telling us. Here's my breakdown of where the NSI.X stands this morning:
P[L1] D[0x0] M[300x250] OOP[F] ADUNIT[] T[]
First, the NSI.X established a classic 5-wave uptrend that ran from its low of $3.95 (October 2001) through the high of $17.32 (August 2012). Note that this uptrend lasted almost 12 years. This led to a 3-wave downtrend that began with the August 2012 high and concluded, as of this reading, with the February 2016 low monthly close of $8.06. The current move looks to be Wave 1 of a new uptrend that, as one respondent noted, is nearing trendline resistance (dotted red line) created by connecting the highs from Wave 5 ($17.32) and Wave B ($14.84, April 2014).
If we add some Dow and Fibonacci retracements to our Elliott Wave we see this trendline resistance falls between the 33% level (Dow) of $11.14 and the 38.2% (Fibonacci) mark of $11.60. A close look at the trendline shows that it crosses these retracement levels between July and September 2016 (green circle). Therefore the NSI.X, despite Monday's sell-off, looks to have time to complete Wave 1.
Has the long-term low been established? Yes, I think so. If the NSI.X starts to pull back initial support would be between $10.28 and $9.72, the 33% and 50% retracement levels of the projected Wave 1. However, Wave 2 often sees nearly a full retracement of Wave 1 before bottoming out. Notice that Wave 2 from April 2004 through September 2004 saw the NSI.X retrace roughly 85% of Wave 1.
Again, I appreciate your responses. The bottom line of my analysis is the market is in a long-term uptrend while approaching an intermediate-term downturn starting the next couple of months.
To track my thoughts on the markets throughout the day, follow me on Twitter: www.twitter.com\DarinNewsom

Comments
To comment, please Log In or Join our Community .