
Technically Speaking
Crazy About the Loonie
At the end of my latest Quarterly Grain Markets Outlook (you can see the rebroadcast here: http://tinyurl.com/…) I was asked a question about the Canadian dollar, aka the loonie. The questioner was looking at the loonie's daily candlestick chart that showed a possible breaking of the neckline in a reverse head-and-shoulders pattern. Her question was, "How often does this pattern form and not actually break out?"
My honest answer is, I don't know. I've always found head-and-shoulders patterns, as well as the reverse edition, hard to peg for a couple of reasons: First, I tend to use longer term charts (e.g. weekly, monthly) meaning the pattern takes a long-time to form and second, most head-and-shoulders formations can be broken down into different patterns.
P[L1] D[0x0] M[300x250] OOP[F] ADUNIT[] T[]
But that doesn't mean this one doesn't exist. I looked at the chart she sent with her follow-up email and viewed in a certain light, it does look like a reverse head-and shoulders with a bullish break of the neckline. If so, her target price becomes 0.7800. Is that possible, let's expand our view a bit to find out.
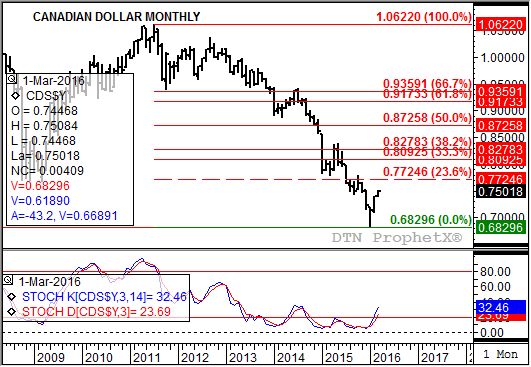
Take a look at the attached monthly chart for the loonie. Note that this past January saw it push to a new low of 0.68296 before posting a strong rally to close at 0.71376. While this was still a lower monthly close, the late move was strong enough to establish a bullish crossover by monthly stochastics (the faster moving blue line crossing above the slower moving red line) with both below the oversold level of 20% (bottom study). In technical terms, it looked like the Canadian dollar had pulled off a bullish spike reversal on its monthly chart meaning the major (long-term) trend had turned up.
February saw the loonie follow this up with a strong rally as momentum (reflected by stochastics) grew more bullish. The close for the month was at 0.74017, mere ticks off the Feb high of 0.74031. Any market's ability to close a time frame (daily, weekly, monthly, etc.) near the high is also a bullish sign and again reflected in a more bullish stochastic study.
As March gets under way the loonie has its first target of 0.77246 clearly in its sights. This price marks the 23.6% retracement level of the previous major downtrend from 1.06220 (July 2011) through the January low. However, if the loonie can clear that level the next target becomes the 33% retracement mark of 0.80925. Given that, the minor (short-term) target near 0.78 looks not only possible, but highly likely of occurring.
What does all of this mean for grains: From a Canadian producers perspective, a stronger loonie could start to pressure basis. On the southern side of the border it could signal, as discussed often in this space, that the U.S. dollar index should come down. If so, it could lead first to a round of noncommercial short-covering (though moving to a net-long position may require a spring weather scare), second to a possible increase in export demand for U.S. supplies, meaning third would be a possible strengthening of U.S. basis.
It was a great question and once again shows there is a lot going on that we have to pay attention to in grain markets.
To track my thoughts on the markets throughout the day, follow me on Twitter:www.twitter.com\Darin Newsom

Comments
To comment, please Log In or Join our Community .