

Technically Speaking
Monthly Analysis: Grain Markets
Corn (Cash): The DTN National Corn Index (NCI.X, national average cash price) closed at $3.29 1/4, down 19 1/4 cents for the month. The major (long-term) trend is sideways with support pegged near $3.23. This price marks the 67% retracement level of the rally from the low of $2.81 1/2 (October 2014) through the high of $4.05 3/4 (July 2016). If this support fails to hold, next support is at the October 2014 low. Monthly stochastics are approaching the oversold level of 20%.
Corn (Futures): The May contract closed at $3.57, down 15 cents on the monthly chart. The major (long-term) trend remains sideways with support at $3.50 1/4. This price marks the 76.4% retracement level of the rally from the low of $3.18 1/4 (October 2014) through the high of $4.54 1/4 (July 2015). If this support fails to hold, the next level is the October 2014 low that occurred in conjunction with a major bullish reversal. Monthly stochastics continue to slide back toward the oversold level of 20%.
P[L1] D[0x0] M[300x250] OOP[F] ADUNIT[] T[]
Soybeans (Cash): The DTN National Soybean Index (NSI.X, national average cash price) closed at $8.06 1/4, down 29 1/4 cents for the month. The major (long-term) trend looks to have turned down again as the NSI.X posted a new low in February. Next support may be at the December 2008 low of $7.30 3/4. However, monthly stochastics have moved into single digits reflecting a sharply oversold situation.
Soybeans (Futures): The May contract closed at $8.61, down 21.25 cents on the monthly chart. The major (long-term) trend remains sideways with support at the low of $8.44 1/4 (November 2015). Monthly stochastics remain below 20%, keeping the market in an oversold situation. If this support fails to hold the next major low is $7.76 1/4 from December 2008. Using a basic measuring technique and the $0.75 3/4 range from the November 2015 low through the December 2015 high of $9.19 3/4, a move below the previous low would project a target of $7.68 3/4.
Wheat (Cash): The DTN National SRW Wheat Index (SR.X, national average cash price) closed at $4.06 3/4, down 30 1/2 cents for the month. The major (long-term) trend turned down again as the SR.X moved to a new low of $4.02 1/4 in February. This put the cash market at its lowest level since June 2010, with next possible support at the March 2010 low of $3.73 1/4. Beyond that is the December 2008 low near $3.12 1/4.
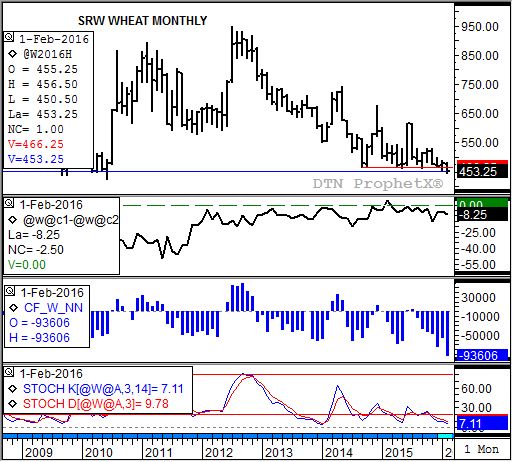
SRW Wheat (Futures): The May Chicago contract closed at $4.53 1/4, down 26 cents on the monthly chart. The major (long-term) trend remains down as the market posted a new low of $4.46 1/2 during February. The monthly close was the lowest since $4.50 1/2 posted at the end of March 2010. Despite monthly stochastics in single-digits, indicating a sharply oversold situation, pressure continues to come from noncommercial selling. However, both those factors could soon lead to a possible bullish turn.
To track my thoughts on the markets throughout the day, follow me on Twitter: www.twitter.com\DarinNewsom

Comments
To comment, please Log In or Join our Community .