Fundamentally Speaking
End of June Corn Crop Ratings
Markets were getting buried Tuesday despite the condition of U.S. soybean and corn crops deteriorating to the worst in decades (according to the USDA's weekly crop progress and condition reports) as major producing areas missed out on much-needed rains.
Nonetheless the markets are forward-looking and perhaps had priced these rating declines in last week as focus is now on what appears to be a major weather pattern change as the Bermuda high has finally moved, allowing a more northern flow of moist air coming from the Gulf of Mexico.
Current crop conditions are on par with two of the worst years since USDA unveiled national crop ratings back in 1986, and these are the two big drought years of 1988 and 2012.
P[L1] D[0x0] M[300x250] OOP[F] ADUNIT[] T[]
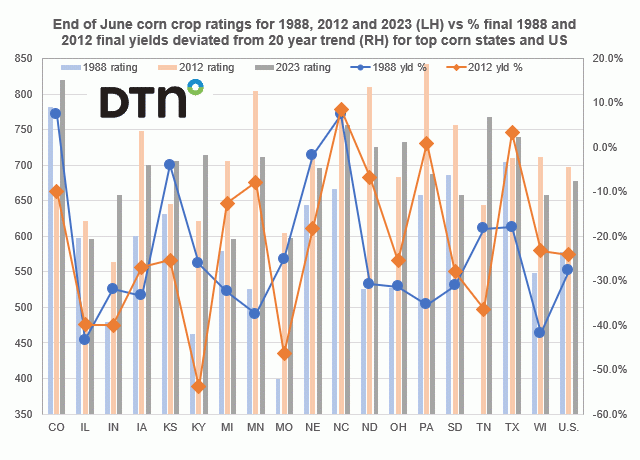
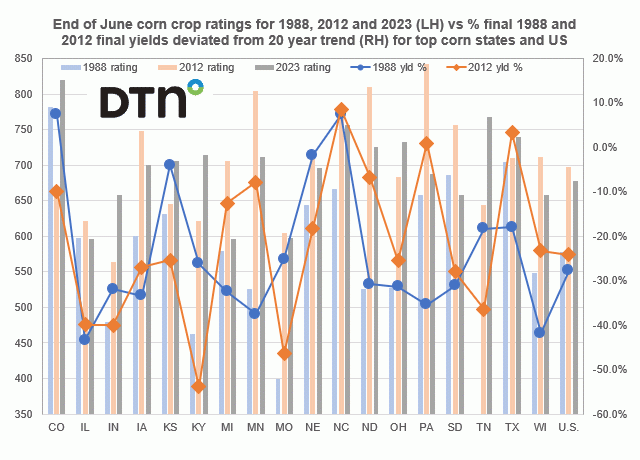
Using our usual ratings system where we weight the crop based on the percent in each category and assign that category a factor of 2 for very poor, 4 for poor, 6 for fair, 8 for good, and 10 for excellent and then sum the results, we plot the end of June or week 25 corn crop ratings for 1988, 2012 and 2023 on the left-hand axis.
On the right-hand axis we report the percent that the final 1988 and 2012 corn yields deviated from the 20-year trend for the top 18 producing states and the U.S.
Note there is no 1988 corn rating for the state of Tennessee.
The current U.S. crop rating of 678 is actually below the 2012 figure, but nowhere near the week 25 U.S. rating of 578 as that year was really one of the worst drought years ever.
There are only two states that have end of June crop ratings this year lower than those seen in 1988 – Illinois, whose current 596 rating is the worst ever, and South Dakota.
11 of the 18 states actually have lower week 25 ratings this year than in 2012 with Michigan in the worst spot relative to 11 years ago.
As noted, markets have plunged as the thought is now, after a month of dealing with adverse weather and the prospect of lower yields, lower production and lower ending stocks than had been projected, perhaps the opposite can occur.
One should not discount what has already occurred as correlation between week 25 corn ratings and percent that states corn yield deviated from 20-year trend was 52.4% for 1988 and an even stronger 74.9% correlation rate in 2012.
(c) Copyright 2023 DTN, LLC. All rights reserved.


Comments
To comment, please Log In or Join our Community .