Fundamentally Speaking
Spring Wheat Area Has Lower Crop Ratings Than Corn, Beans
A lot of attention will be focused on USDA's supply-demand report next Wednesday where they will use updated June 30 acreage numbers to adjust corn, soybean and wheat production for the 2023 growing season.
With much of Corn Belt having a very dry May and first three weeks of June, even recent rains are unlikely to prevent USDA from lowering their corn and soybean yield estimates given that current crop conditions as of the beginning of July are the worst since 2012.
Receiving perhaps less attention is the U.S. spring wheat crop where USDA on Monday reported that spring wheat ratings fell 2 percentage points to just 48% in good-to-excellent condition, while analysts on average had expected an improvement to 52%.
P[L1] D[0x0] M[300x250] OOP[F] ADUNIT[] T[]
Using our usual ratings system where we weigh the crop based on the percent in each category and assign that category a factor of 2 for very poor, 4 for poor, 6 for fair, 8 for good, and 10 for excellent and then sum the results.
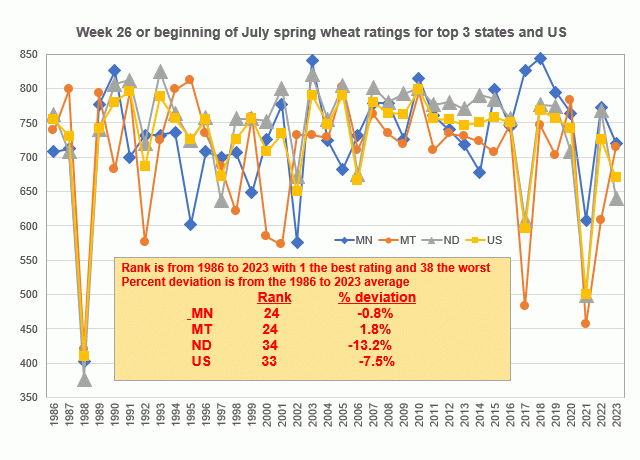
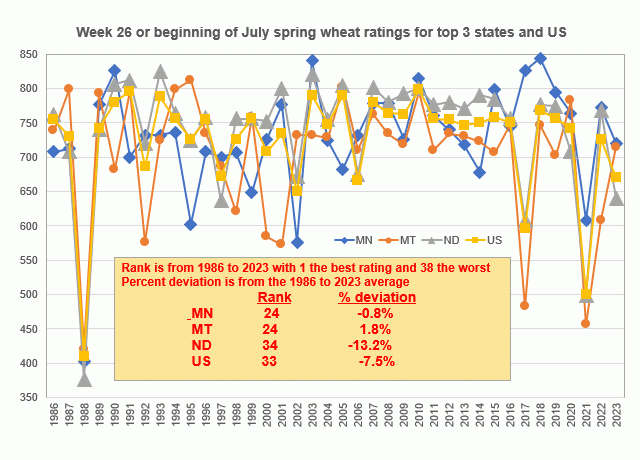
This chart shows the week 26 (or around the beginning of July) spring wheat ratings for the top three producing states, which includes Minnesota which is third, Montana which is second and then North Dakota which is the nation's largest spring wheat producing state and the U.S. figure is also included.
Also included is a table which reports the rank of the 2023 rating from the period 1986 to 2023 with a rank of 1 the best rating and 38 the worst.
The percent deviation from each state and U.S. week 26 rating using 1986 to 2023 values is also calculated.
Interesting to note that while the percent of the U.S. corn crop area in drought is 67% and that for soybeans 60%, only 19% of the U.S. spring wheat production area is in drought this year, yet the current U.S. spring wheat rating is 33 or 6th worst since ratings began back in 1986 and the third worst since 2006 at 7.5% below average.
One reason is that North Dakota, the largest producing state, has its fifth worst beginning of July rating since 1986 at 13.2% below its average.
This implies USDA will report a yield that should be well below the year ago 46.2 bushels per acre figure and the 25-year trend yield of 47.7.
(c) Copyright 2023 DTN, LLC. All rights reserved.


Comments
To comment, please Log In or Join our Community .