

Fundamentally Speaking
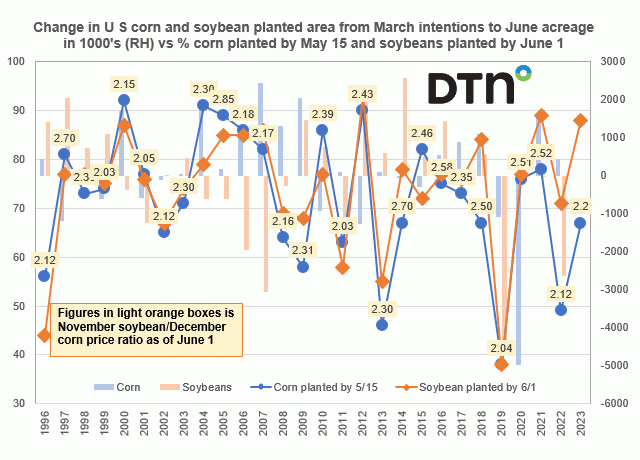
Change in Corn, Soybean Planted Area

The USDA will release its updated planted area figures for the 2023 U.S. corn and soybean crops on June 30.
Recall on March 31 in its Prospective Plantings report the USDA indicated that U.S. farmers intended to sew 92 million acres of corn, above the trade guess of 90.9 million.
Soybean planting intentions were pegged at 87.5 million acres which was below the average trade estimate of 88.2 million.
This chart shows the change in U.S. corn and soybean planted area from the March intentions to June acreage report in 1000 acres on the right-hand axis vs the percent of corn planted by May 15 and soybeans planted by June 1 on the left-hand axis.
P[L1] D[0x0] M[300x250] OOP[F] ADUNIT[] T[]
Also reported in the light orange boxes is the November soybean/December corn price ratio as of June 1.
It is thought that a quicker than normal pace of plantings may result in higher seeded area than was indicated in the March intentions while vice-versa, a lagged pace of seedings could result in the June acreage figures coming in below the March intentions.
Changes in planted area can also be linked to different estimates of crop profitability hence a look at the SX/CZ ratio as of June 1 as a figure above 2.37 is seen more in favor of soybean seedings than corn and a ratio below that more in favor of corn seedings as opposed to soybeans.
Since 1996, corn plantings as of May 15 have averaged 72% while soybean seedings as of June 1 have averaged 74%.
This year, 67% of the 2023 corn crop was in the ground as of May 15, a little below average but well above the year ago figure of 49%, the third slowest pace since 1996 and with only the 46% corn seeding rate in 2013 and 38% in 2019 slower.
Last year, even with a very slow planting pace, corn acreage actually increased 431,000 acres from March to June helped by a 2.12 bean/corn ratio in favor of corn.
2019 saw the slowest planting paces ever for both crops with corn seeded as of 5/15 at 38% and beans also at 38% planted as of June 1.
Corn area did contact by 1.092 million acres, though the decline moderated by the SX/CZ ratio of 2.04, but the drop in soybean area of 4.577 billion is actually the largest decline ever posted between the two reports.
Soybean seedings this spring sped along with 88% in the ground as of June 1, the third highest ever topped only by the 89% rate in 2021, yet even that and a 2.52 SX/CZ ratio strongly in favor of soybeans still resulted in a 45,000 drop in soybean area between the March and June reports.
The 2012 planting pace of 93% did result in bean acreage increasing a sizable 2.178 million but that was a severe drought year as corn's planting pace that season the third highest since 1996.
(c) Copyright 2023 DTN, LLC. All rights reserved.
Comments
To comment, please Log In or Join our Community .