

Fundamentally Speaking
Corn Ratings and Final Yields
Tuesday's weekly corn and soybean crop condition ratings released by the USDA were a real shot across the bow as percent of corn rated good or excellent is now just 55%, down 6% from the prior week when trade was looking for just a 2-3 % drop, while bean ratings off 5% to 54% when decline of 1-2% was anticipated.
Sobering is fact that weather last week appeared to be more favorable than the week prior with temperatures in many areas of Midwest averaging below normal and decent amounts of rain in areas of both western and eastern areas of the Corn Belt along with more precipitation in sections of the Plains and Delta.
Dynamic market action in the wake of these numbers reflects falling yield and production projections with forecasted moisture in the center of Corn Belt woefully light.
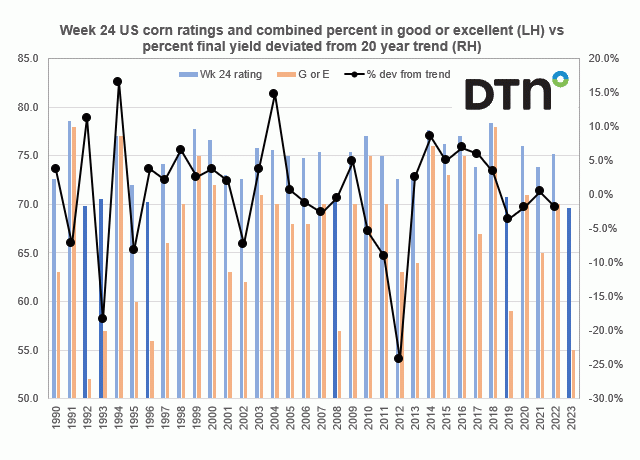
This chart shows on the left-hand axis the USDA corn condition report using a slightly different version of our usual ratings system where we weight the crop based on the percent in each category and assign that category a factor of 0.2 for very poor, 0.4 for poor, 0.6 for fair, 0.8 for good, and 1.0 for excellent and then sum the results.
Also on the left-hand axis is the combined percent of the U.S. corn crop rated in either the good or excellent category.
P[L1] D[0x0] M[300x250] OOP[F] ADUNIT[] T[]
Both are calculated as of week 24 which is around June 20.
On the right-hand axis is the percent that the final U.S. corn yield that year deviated from the 20-year trend.
The glass half empty side of the story notes that this year's week 24 rating of 69.6 is the lowest since at least 1990 and the combined 55% either good or excellent is the second lowest since 1990 with only 1992 worse at just 52% good or excellent as that year had second lowest rating of 69.8.
The glass half full scenario notes that this is still only just past the middle of June so there is time for more favorable weather should it develop to help improve crop ratings and yield potential.
The average week 24 rating from 1990-2023 is 74.4 and one standard deviation is 2.6 so we looked at those years with ratings at 71.8 or below and there are six including 1992, 1993, 1996,2008, 2019 and this year.
It turns out that 1992 saw a record corn yield a whopping 11.2% above trend although we have seen a lot of talk that 1992 was a special case due to the explosion of Mount Pinatubo the prior fall that kept summer temperatures well below normal.
1993 was also a special case as we saw final corn yields that season at a stunning 18.4% below trend but that was due to huge summer floods that season as opposed to drought that devastated the crop in many parts of the country.
1996 had yields 3.7% above trend, 2008 they were at trend and 2019 down 3.6% from trend.
This and the fact that the correlation between week 24 crop ratings and percent corn yields deviate from trend is only 27% shows there is still time for rains to arrive and help resurrect the crop.
With corn about to enter its critical pollination period, for the driest sections of corn the time for rains is now.
(c) Copyright 2023 DTN, LLC. All rights reserved.

Comments
To comment, please Log In or Join our Community .