

Fundamentally Speaking
Percent of Soybeans Setting Pods 2nd Lowest Since 1997
This past week USDA reported that the U.S. soybean crop is rated only 54% good or excellent, 4% below that of corn for the combined good or excellent ratings.
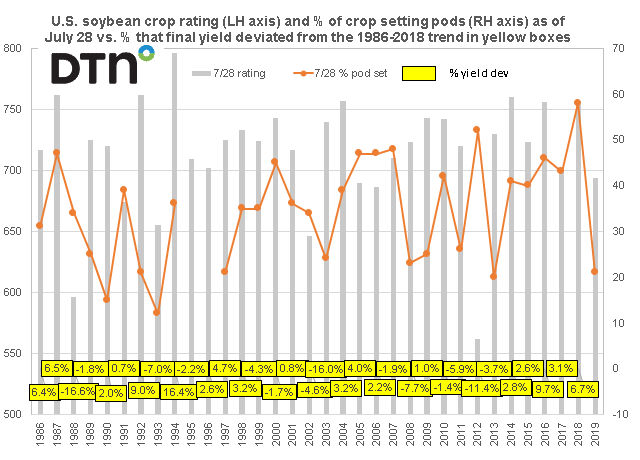
This graphic shows the U.S. soybean crop rating as of July 28th on the left hand axis using our usual ratings system (where we weight the crop based on the percent in each category and assign that category a factor of 2 for very poor, 4 for poor, 6 for fair, 8 for good, and 10 for excellent and then sum the results).
P[L1] D[0x0] M[300x250] OOP[F] ADUNIT[] T[]
The percent of crop setting pods as of July 28th is then plotted on the right hand axis while the percent that final yield U.S. soybean yield deviated from the 1986-2018 trend is reported in the yellow boxes.
The latest USDA crop condition report showed current soybean ratings like corn the lowest since the drought year of 2012 and prior to that 2006 while the current percent of the nation's soybean crop setting pods at 21% is the lowest figure for this point in the growing season since 2013 and prior to that 1997.
For some reason the USDA did not publish the percent of soybean setting pods in late July 1995 or 1996.
We ran a simple regression of July 28 crop conditions and percent setting pods as of the same date.
This only explains about 48.2% of the variability the percent the final U.S. soybean yield deviated from the 1986-2018 trend.
Nonetheless, plugging the figures in shows yields 4.4% below trend calculated at 48.9 bushels per acre (bpa) for this year, resulting in an estimated yield of 46.7 bpa, below the current USDA projection of 48.5 bpa.
(KM)

Comments
To comment, please Log In or Join our Community .