

Fundamentally Speaking
Corn Rating Lowest Since 2012, Percent Silking Slowest Since 1997

The all-important August 12 crop production report is coming up.
Hopefully USDA will give greater clarity to how much acreage was planted of the key crops and what yield potential will be.
Based on record rainfall in much of the Midwest, the pace of U.S. corn plantings were the slowest ever this past spring and that is expected to take a toll on both seeded area and yields.
P[L1] D[0x0] M[300x250] OOP[F] ADUNIT[] T[]
Furthermore, with the crop seeded in the ground at the latest point ever, development is lagging so much in many key producing regions it will be a race against time to get the corn plants mature prior to the onset of the first killing fall freeze.
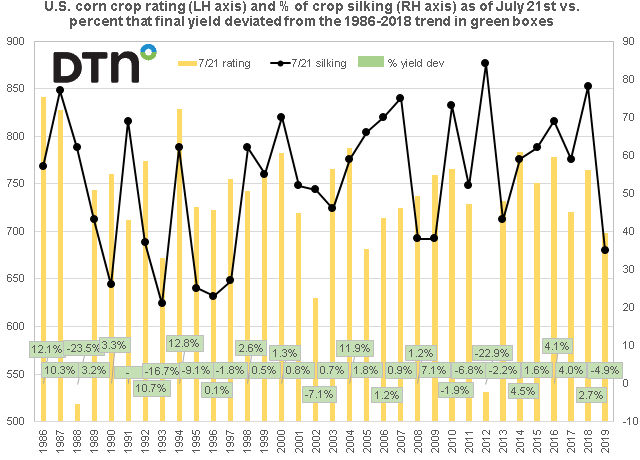
This graphic shows the U.S. corn crop rating as of July 21 on the left hand axis using our usual ratings system, where we weight the crop based on the percent in each category and assign that category a factor of 2 for very poor, 4 for poor, 6 for fair, 8 for good, and 10 for excellent and then sum the results.
The percent of crop silking as of July 21 is then plotted on the right hand axis while the percent that final yield U.S. corn yield deviated from the 1986-2018 trend is reported in the green boxes.
The latest USDA crop condition report showed current corn ratings the lowest since the infamous drought year of 2012 and prior to that 2005 while the current percent of the crop silking at 35% is the lowest figure for this point in the growing season since 1997.
For curiosity, we ran a simple regression of July 21 crop conditions and percent silking and it explained a rather healthy 78.2% of the variability the percent the final U.S. corn yield deviated from the 1986-2018 trend.
Plugging the figures in show yields 4.9% below trend, which this year we calculate at 173.9 bushels per acre (bpa) and that results in an estimated yield of 165.3 bpa, very close to the figures we have heard bandied about and just a shade below the June USDA WASDE figure of 166.0 bpa.
(KA)
Comments
To comment, please Log In or Join our Community .