Fundamentally Speaking
US Soybean Yield Trends
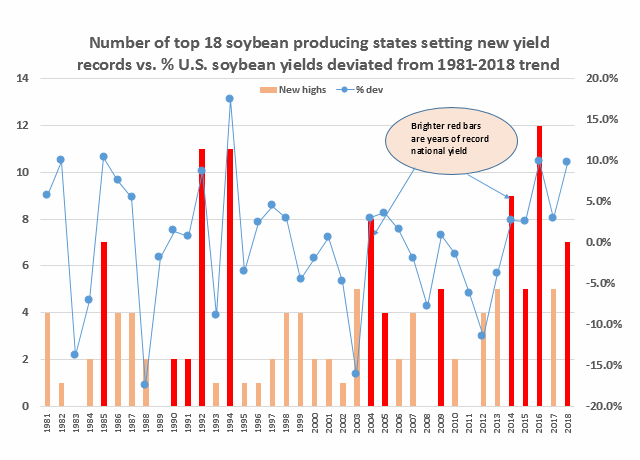
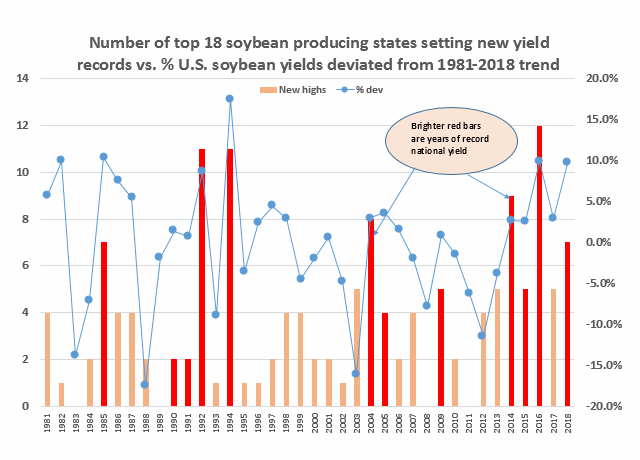
Similar to our corn analysis, this graphic shows the number of the top 18 soybean producing states setting new yield records on the left hand axis. These are plotted vs the percent that the final national soybean yield deviated from the 1981-2018 trend with the exception of this year where we use the October 2018 USDA yield estimate on the right hand axis.
P[L1] D[0x0] M[300x250] OOP[F] ADUNIT[] T[]
We count seven states having attained new all-time high yield, which is not as large a number as we would have expected with the 2018 yield estimated at 9.7% above trend. Two years ago the U.S. set a national soybean yield record of 52.0 bushels per acre which was 9.8% above trend and 12 of the top 18 producing states set all-time high yields which is the largest number we have going back at least to 1981.
Both 1992 and 1994 were remembered as being stellar growing season with both having 11 states with all-time highs up to that point in time with yields 8.7% and 17.5% respectively above trend.
The correlation between a record high national soybean yield and the number of the top 18 states also setting a peak yield is about 56%.
There is some concern that record precipitation in much of the Midwest over the past thirty days has not only slowed the harvest to one of its slowest paces in years but may result in lost bushels and quality deterioration.
We noted previously that since 1980 when the USDA has increased its national soybean yield projection from the August to September report and also in October there has been a 90% chance that the final yield values issued in the January production report will be higher than the October estimate.
(KLM)
© Copyright 2018 DTN/The Progressive Farmer. All rights reserved.


Comments
To comment, please Log In or Join our Community .