

Fundamentally Speaking
Oct-Feb Precipitation vs. Kansas Wheat Yields

The Southern and Central Plains continue to endure drought conditions with subfreezing temperatures adding insult to injury.
Therefore, it should be no surprise that in its first winter wheat condition report of the spring, USDA reported one of the worst rated crops for this time of year in history.
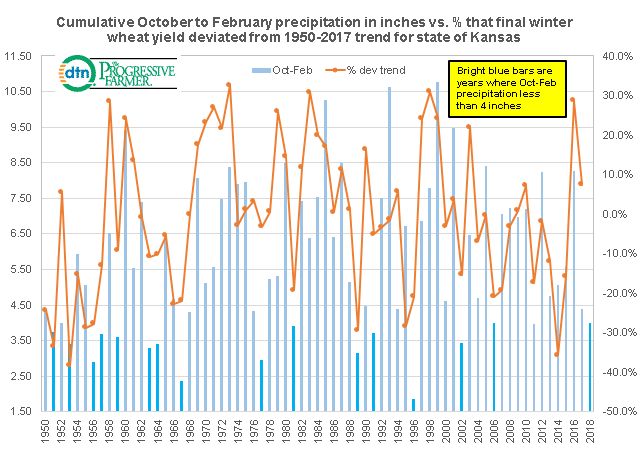
In this piece we look at the cumulative October to February precipitation in inches for the largest winter wheat producing state of Kansas and the percent that final wheat yields in that state deviated from the 1950-2017 trend.
P[L1] D[0x0] M[300x250] OOP[F] ADUNIT[] T[]
The results imply a well-below trend yield for the Kansas crop this year as there have been 16 years since 1950 when precipitation over these five months has been less than 4.00 inches and each and every one of those years final Kansas wheat yields have been well below trend.
The average rainfall for all of these years is 3.34 inches resulting in yields averaging 18.5% below trend.
Note that the 1950-2017 average rainfall is 5.86 inches so this year's total is only 68.1% of that.
We see that in 2011 Oct-Feb total precipitation was 3.97 inches with Kansas wheat yields that year 17.4% below trend and in 2006 it was also 3.99 inches with wheat yields that season 21.0% below trend.
A simple regression estimates wheat yields this year at 9.8% below trend which for 2018 we estimate at 45.1 bushels per acre (bpa) which would result in a wheat yield of 40.7 bpa.
(KA)
© Copyright 2018 DTN/The Progressive Farmer. All rights reserved.
Comments
To comment, please Log In or Join our Community .