

Fundamentally Speaking
Wheat Export & Shipment pace
The USDA is forecasting U.S. wheat stocks to be at their highest levels in close to 30 years for even though prices have been at ten year lows, feed utilization and exports have been disappointing despite the low prices.
Though the USDA kept its 2016/17 export projection unchanged at 975 million bushels that figure is actually below the five-year average which includes the year ago 775 million bushels which was the lowest export figure since the 1971/72 season.
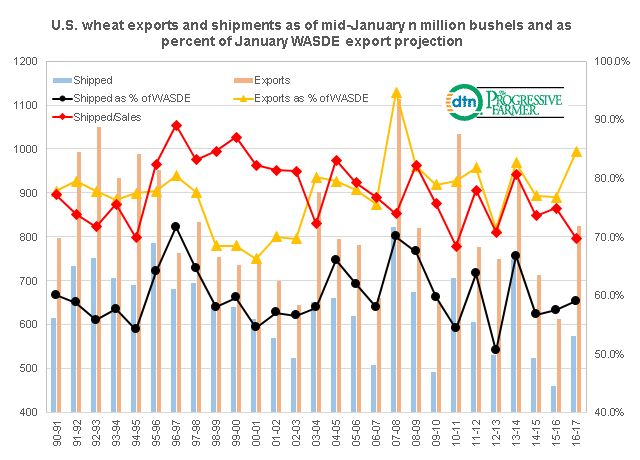
Similar to what we have done with corn and soybeans, this graphic shows U.S. wheat exports and shipments in million bushels on the left hand axis and on the right-hand axis both the exports and shipments as a percent of the January WASDE export projection.
P[L1] D[0x0] M[300x250] OOP[F] ADUNIT[] T[]
Also plotted on the right hand axis is the shipped to sales ratio.
Current sales or exports through mid-January this year are 824 million bushels which is the second largest export total for mid-January in the past five years.
This is about 84.5% of the USDA export projection, a fairly high percent and actually the highest since the 2007/08 season.
The amount shipped however is 575 million bushels and that is 59% of the January 975 million bushel export projection, exactly equal to the five year average.
The final marker is the percent of shipped vs. sold which is the red line and for mid-January this year comes in at 69.8% which other than the 68.3% pace for mid-January seen in the 2010-11 marketing year is the lowest ship to sales ratio pace since at least 1990.
(KA)
© Copyright 2017 DTN/The Progressive Farmer. All rights reserved.

Comments
To comment, please Log In or Join our Community .