

Fundamentally Speaking
Crude Oil-Corn Ratio One Year Later

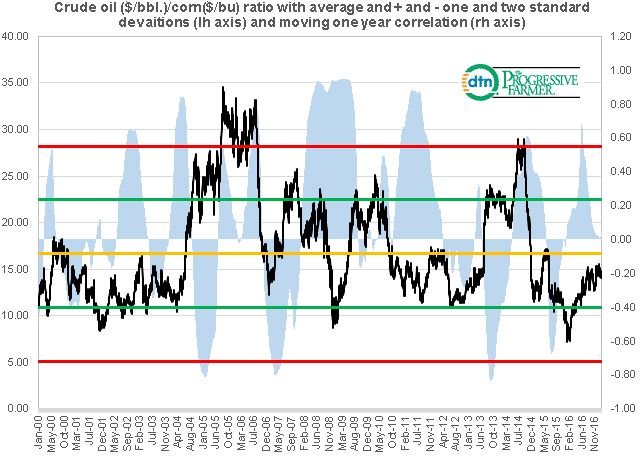
It was about a year ago when we looked at the crude oil in $ per barrel vs. corn in $ per bushel ratio.
About this time, crude oil was trading near $31 per barrel and would sink as low as $26.21 and trade near 13-year lows.
Around the same time, corn was trading for about $3.70 per bushel so the crude oil/corn ratio was around 8.38 and eventually this ratio would get as low as 7.625.
P[L1] D[0x0] M[300x250] OOP[F] ADUNIT[] T[]
Not only was this well below the long-term average ratio of 16.65 but was well below the negative one standard deviation line of 10.87, a level where values trade at or below only 16% of the time since 2000, but was getting very close to the negative two standard deviation line of 5.09 where values trade at or below only 2.5% of the time.
We opined that going long crude oil and short corn on a ratio basis seems like a favorable trade and fast-forwarding a year, with crude oil trading at $53.52 per barrel and corn at $3.60 the ratio is now closer to the long-term average at 14.84.
Note that it has been a crude oil rally that has lifted this ratio with corn priced about the same now as a year ago.
Furthermore, in past years there has been times when corn price movements were highly correlated with price action in crude oil as they were tied together by ethanol.
With the plateauing of the ethanol industry this is no longer the case and since the fall the correlation between crude oil and corn has been close to zero as the rally in crude oil has really not had that much of a supportive impact on corn or to be truthful any other member of the grain and oilseeds complex.
(KA)
© Copyright 2017 DTN/The Progressive Farmer. All rights reserved.
Comments
To comment, please Log In or Join our Community .