

Fundamentally Speaking
Prospective 2016/17 Ending Soybean Stocks Matrix

In light of recent events we have dusted off and updated our soybean planted acreage and yield matrix table of prospective ending stocks.
The trade is looking for soybean acreage to be 1.60 million higher than the 82.2 million indicated in the March Prospective Plantings report.
This is important in that not only is there concern about what final soybean yields will be given an approaching La Nina but foreign demand for U.S. soybeans has skyrocketed over the past three months for both this and next marketing year linked to late season production declines in South America kicking some export business back to the U.S. but also as insurance in case U.S. crop conditions were to deteriorate sharply due to bad weather.
Recall the USDA back in February at their annual Ag Outlook Forum had forecast 2016/17 beginning soybean stocks at 450 million bushels, 2016 production at 3.810 billion, export demand at 1.825 billion and ending stocks at 440 million with a stock to use ratio of 11.4% and an average farm price of $8.50 per bushel.
P[L1] D[0x0] M[300x250] OOP[F] ADUNIT[] T[]
Fast forward four months later for the June 2016 WASDE report now has 2016/17 beginning stocks at 370 million based on a surge in old crop export business, production still pegged at 3.80 billion bushels, export demand now projected at 1.90 billion, an ending stocks figure of 260 million bushels with a stock to use ratio of 6.6% and an average farm price of $9.50 per bushel.
Hence, the market now desperately needs the forecasted 1.60 million acre increase in planted area but also for yields to at least attain their trend of 46.7 bushels per acre (bpa) if not higher for there is no room on the current balance sheet for any yield adversity.
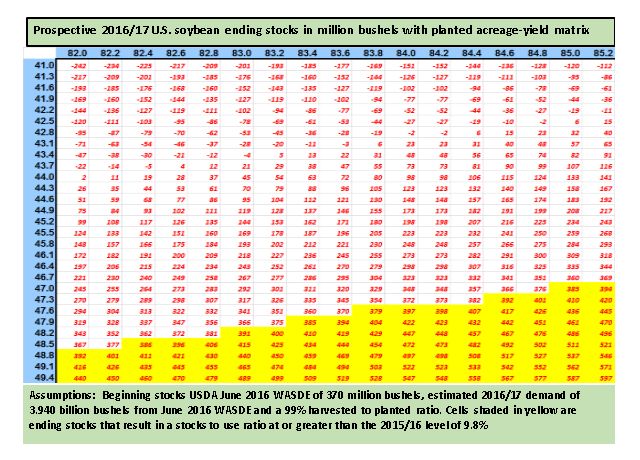
This is illustrated in the accompanying graphic that shows prospective 2016/17 U.S. soybean ending stocks in million bushels with a planted acreage-yield matrix.
The cells within the boxes show the beginning stocks of 370 million bushels plus production which is the product of the planted acreage numbers at the top going across the x-axis times 99% which is the normal harvested to planted ratio times the yield in bpa going down the y-axis and from that next year's estimated demand of 3.940 billion bushels is subtracted.
The cells in yellow are ending stocks that result in a stock to use greater than the 2015/16 level of 9.8%.
One can see why the anticipated increase in 2016 U.S. planted acreage is not only desired but needed for if acreage is unchanged at the March Prospective Planting figure of 82.2 million then 2016 yields will have to be a record 48.8 bpa to keep the 2016/17 stock to use ratio at least at 9.8%.
If the USDA increases this year's and/or next year's demand the threshold is even higher.
Even if Thursday's acreage report matches the trade expectation of 84 million final 2016 yields will still have to be 47.6 bpa instead of the forecasted 46.7 to keep the stock to use ratio at a 9.8% level.
(KA)
Comments
To comment, please Log In or Join our Community .