

Fundamentally Speaking
U.S. Soybean Export & Sales Pace
The speculative commodity funds that have piled onto the long side of the grain and oilseeds complex over the past two months, especially in the oilseeds complex were rewarded with bullishly construed new crop supply-demand estimates from the USDA this past week.
Based on less competitor supplies the USDA in its WASDE report this past week boosted 2015/16 soybean exports by 35 million bushels to 1.740 billion and next year to 1.885 billion which would be a new record.
P[L1] D[0x0] M[300x250] OOP[F] ADUNIT[] T[]
For the current season USDA has hiked our projected exports by 50 million bushels over the past two months after a sluggish start, though in light of the current sales pace, is this increase justified?
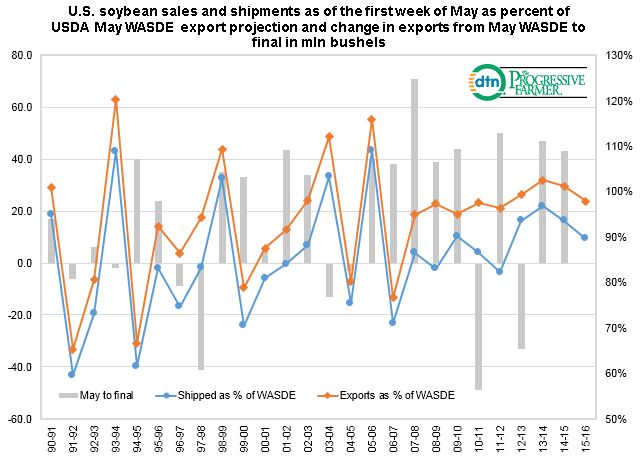
The accompanying chart shows U.S. soybean export sales and shipments as of the first week of May as a percent of the USDA's May WASDE export projection and also the change in U.S. exports from that May WASDE report to the final figure in million bushels.
This year's cumulative shipment and sales figures through the first week of May are 1.600 billion and 1.704 billion bushels respectively, which is 89.6% and 97.9% of the latest 1.740 billion export projection.
Both of these percentages are the lowest in four years, and note that last year the final export figure was 43 million bushels higher than the May WASDE; in 2014 it was 47 million higher and in 2013 the final export figure was 33 million bushels below the May 2013 WASDE estimate.
Looking at the history since 1990 the largest upward revision in exports from the May WASDE projection was in 2007 when the final figure was 71 million bushels higher while in 2011 the final number was 49 million lower than the May WASDE estimate.
(KA)

Comments
To comment, please Log In or Join our Community .