

Canada Markets
AAFC's Initial Seeded Acre Estimates Compared to Final
The January edition of the Canada: Outlook for Principal Field Crops, due for release this month by Agriculture and Agri-Food Canada (AAFC), will contain a first look at supply and demand estimates for the upcoming 2024-25 crop year. This is an unofficial estimate, with the seeded area based on AAFC's ideas of how producer decisions will be made based on current supply and demand conditions, prices, input costs and drought conditions, to name a few.
Looking strictly at AAFC's January acreage estimates during the past five years for the select crops shown on the attached graphic, the smallest range in AAFC's estimates is seen for corn, at 395,400 acres from the lowest estimate to the highest estimate (not shown on the attached graphic). The highest range of estimates during the past five years is seen for canola, with the January estimates during the past five years showing a 2.595-million-acre spread between the lowest estimate and the highest estimate. Of course, this range cannot happen in a vacuum, with the wheat (excluding durum) range shown at a significant 2.219 million acres during the past five years.
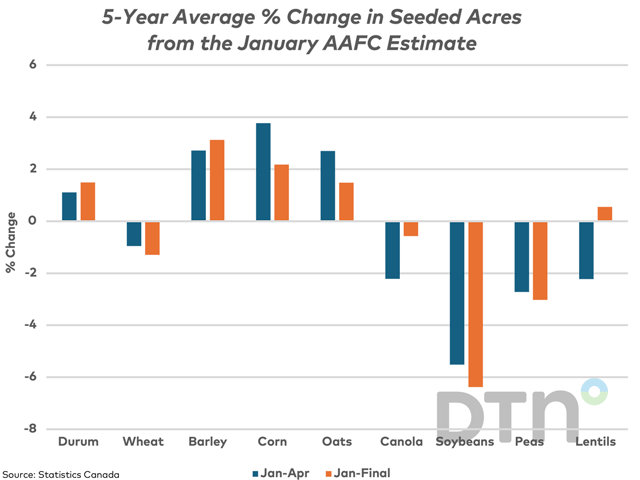
The blue bars on the attached chart shows the five-year average change in the seeded area estimate from the January AAFC estimate to Statistics Canada's first Principal field Crop areas report, normally released in late April. The Statistics Canada report is based on producer surveys.
P[L1] D[0x0] M[300x250] OOP[F] ADUNIT[] T[]
It is interesting to note that this process was changed in 2023 in what is likely due to cost-cutting measures. In past years, Statistics Canada surveyed 11,500 producers during March, just prior to spring seeding. In 2023, the process was changed to include surveys of 9,500 producers, while the survey took place much earlier from mid-December to mid-January, a change that drew criticism from the trade.
The brown bars represent the five-year average percent change from the January estimate to the current Statistics Canada forecast, which may include revisions.
As seen on the chart, the January acreage estimate tends to be revised higher at a later date for durum, barley, corn and oats. As well, the January estimate tends to be revised lower for wheat (excluding durum), canola, soybeans and peas.
The most consistent change during the five years is seen in the soybean area estimate, which has also faced the largest percent change. During the past five years, the January forecast was revised lower each year and by an average of 5.5% over this period, while the final area seeded each year as seen in current Statistics Canada tables is also lower each year, averaging 6.4% lower.
Cliff Jamieson can be reached at cliff.jamieson@dtn.com.
Follow him on X, formerly known as Twitter, @CliffJamieson.
(c) Copyright 2024 DTN, LLC. All rights reserved.

Comments
To comment, please Log In or Join our Community .