

Canada Markets
Statistics Canada March 31 Grain Stocks
Statistics Canada released their Stocks of Principal Field Crops, March 31, 2023, report Tuesday. The report was summarized by saying that stocks of wheat, canola, barley, oats and soybeans were up from one year ago. At the same time, the agency cautions that overall stocks of grain have increased year over year due to the significant increase in 2022 production when compared to the 2021 drought year.
Statistics Canada's Note to Readers may draw some attention and will be a topic for further discussion. In 2022, this report indicated that on-farm stocks are determined following surveys with 11,500 producers. This year's report indicates that farm stocks are "modeled using survey estimates and administrative data. This new methodology is a continuation of the AgZero initiative, which aims to reduce respondent burden while producing high-quality estimates using alternative methods."
While farm stocks are the missing link when estimating grain stocks, it is unclear just what "alternative methods" are being utilized in the 2023 report. This move comes as Statistics Canada remains under fire over the recent decision to move the producer seeding intentions survey from the historical March period to the preceding December/January, a move that many feel is too early to capture producer intentions.
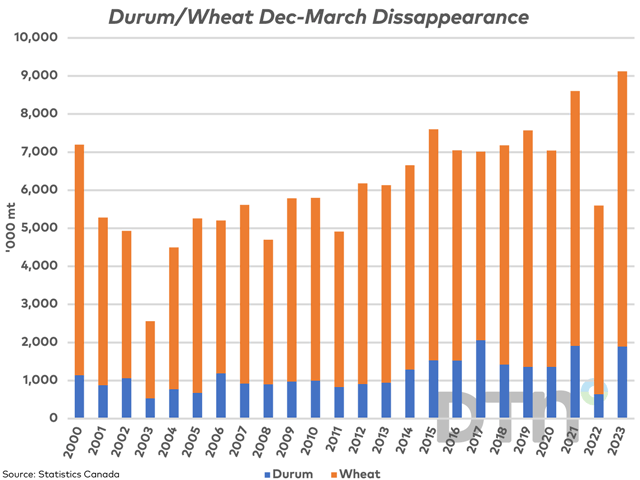
All-wheat stocks in Canada were estimated up 18.2% from one year ago to 13.261 million metric tons (mmt), while is 18.8% below the five-year average. As seen on the accompanying chart, disappearance calculated for the Dec. 31-March 31 period is calculated at 9.121 mmt, which is a record for this three-month period or quarter.
P[L1] D[0x0] M[300x250] OOP[F] ADUNIT[] T[]
Wheat stocks (excluding durum) are estimated at 11.455 mmt, up 22.9% from last year while 13.2% below the five-year average. This is the second-lowest stocks reported in 15 years, or since 2008. It is interesting to note that commercial stocks of wheat fell by a modest 0.3% year over year, while farm stocks increased 35% to 8.234 mmt. December-March disappearance of wheat is calculated at 7.230 mmt (Statistics Canada's Dec 31 stocks -- March 31 stocks), which is up 23.3% from the five-year average and as indicated on the attached chart, is a record disappearance for this quarter. Note that the Dec. 31, 2022, stocks of wheat were revised 86,000 metric tons higher this month.
Durum stocks are estimated at 1,806 mmt, down 4.8% from one year ago and 42.4% below the five-year average for this date. Farm stocks increased by 6.6% year over year while commercial stocks fell by 18.7% to 697,000 metric tons, the lowest reported in five years. Disappearance of durum over the Dec-March quarter is calculated at 1.891 mmt, which is 41.5% higher than the five-year average.
Canola stocks as of March 31 were reported at 5.948 mmt, up 15.3% from one year ago while 32.1% below the five-year average for this date. Commercial stocks are reported to fall by 26.2% to 1.283 mmt, the lowest reported for this date in 13 years. At the same time, farm stocks swelled by 36% to 4.665 mmt, although this remains 35% below the five-year average for this date. Dec. 31 canola stocks were revised 309,000 metric tons (mt) higher in this report, while the Dec-March disappearance is seen at 5.717 mmt, up 20.5% from the five-year average.
Barley stocks are estimated at 2.667 mmt, up 43.9% from last year and 7.8% below the five-year average. Stocks of barley on farm and in commercial storage increased from the same date in 2022. Statistics Canada tables show feed consumption of barley at 4.955 mmt so far this crop year, up 1.3 mmt from the same period last crop year due to increased supplies and feed demand while compares to the five-year average of 4.824 mmt.
Oat stocks are estimated at 2.634 mmt, up 114.5% from one year ago and 53.8% higher than the five-year average. While Statistics Canada commentary indicates this is a record level of stocks for this date, their tables show March 2009 stocks at 2.720 mmt. Commercial stocks have increased by a modest 65,000 mt year over year, while farm stocks are estimated to have swelled by 1.341 mmt or 145%. Feed use is estimated at 1.169 mmt over the August-March period, which compares to the five-year average of 810,560 mt.
Lentil stocks were reported at 900,000 mt, down 13.6% from one year ago and 40% below the five-year average and the lowest March 31 stocks reported in seven years. Dry pea stocks of 1.471 mmt are up 22.4% from one year ago and 19.4% below the five-year average.
Canada's corn stocks fell 2.2% from March 31 to 9.075 mmt due to an increase in farm stocks. This is up 6.8% from the five-year average for this date. Industrial use is reported at 3.415 mmt from September through March, a record level of industrial demand, while feed use of corn has fallen sharply to 4.973 mmt from 7.243 mmt reported in the same period of 2022 due to lower imports of U.S. corn that was fed in western Canada.
Soybean stocks increased by 6.1% to 1.995 mmt as of March 31, while 22.8% below the five-year average for this date. This inventory is seen close to evenly split between farm storage and commercial storage, with a significant 12.2% increase noted for farm stocks. Dec. 31, 2022, stocks were revised 175,000 mt lower in this report, while the Dec-March disappearance of 1.484 mmt is up 13.7% from the five-year average.
Cliff Jamieson can be reached at cliff.jamieson@dtn.com
Follow him on Twitter @Cliff Jamieson
(c) Copyright 2023 DTN, LLC. All rights reserved.

Comments
To comment, please Log In or Join our Community .