

Canada Markets
Canola Stocks May Spell Trouble for the Speculative Shorts
Canola futures showed volatility on Wednesday, with the July contract trading over a $22.20/metric ton range, closing $3.40/mt lower at $734.70/mt. The November contract closed $2.20/mt lower, at $711.60/mt, after trading over an $18.80/mt range. Both closed close to the mid-point of this session's trading range, with daily volume in the July contract the highest in 15 sessions and the highest seen during the life of the contract for the November.
As of CFTC data for May 2 and released on May 5, we see noncommercial traders holding a bearish net-short position for a 17th week, increasing this position for a second straight week to 72,522 contracts, which is the highest seen in five weeks.
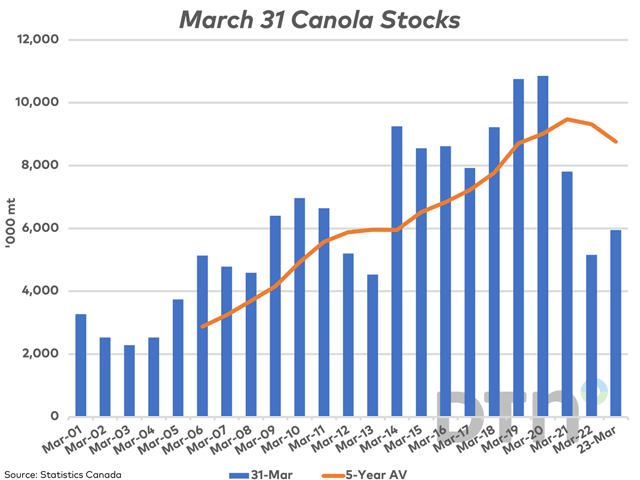
Since then, Statistics Canada reported on May 9 that March 31 stocks of canola at 5.948 million metric tons are up 15.3% from one year ago, which must mean everything is good? The problem with this comparison is that the 2021 canola crop was sharply reduced by drought, with 2021 production of 13.752 mmt down 29.4% from the previous year while March 31 stocks in 2022 were down 34% from the previous year and the lowest March stocks reported in nine years. As stated by Statistics Canada this week, "In general, stocks of principal field crops increased compared with the same date one year earlier because of higher production, most notably in Western Canada, where improved growing conditions resulted in better yields."
P[L1] D[0x0] M[300x250] OOP[F] ADUNIT[] T[]
What is relevant is that March 31 stocks are reported at a level that is 32.1% below the five-year average. March 31 stocks are the second-lowest level seen since 2013, or 10 years, while this is a third consecutive year that March 31 stocks are reported below the previous five-year average.
Over the past five years, the April-through-July 31 disappearance, based on Statistics Canada stocks estimates, averages 6.131 mmt, while over 10 years this average is 5.992 mmt. Both calculated volumes are higher than the current March 31 stocks estimate, which signals the likelihood that demand will need to be rationed prior to new-crop availability.
The Canadian Grain Commission's most recent Grain Statistics Weekly for week 39 or the week ending April 30 shows cumulative exports through licensed facilities at 6.7495 mmt, or 5% below the five-year average for this period. At the same time, domestic disappearance is shown at 7.781 mmt, which is up 5.3% from average.
CGC data from week 35 to week 39 (April 2-30) shows licensed exports of 638,500 mt and domestic disappearance of 844,300 mt, or 1.483 mmt in total. This reduces estimated stocks to 4.465 mmt, with three months of demand remaining while the need remains to account for a minimal level of ending stocks.
Demand has yet to be rationed. Note that AAFC is currently forecasting 2022-23 ending stocks at 1 mmt, while the USDA is using an estimate of 1.040 mmt. Both estimates face a downward revision.
Cliff Jamieson can be reached at cliff.jamieson@dtn.com
Follow him on Twitter @Cliff Jamieson
(c) Copyright 2023 DTN, LLC. All rights reserved.

Comments
To comment, please Log In or Join our Community .