

Canada Markets
December HRS is Testing Resistance
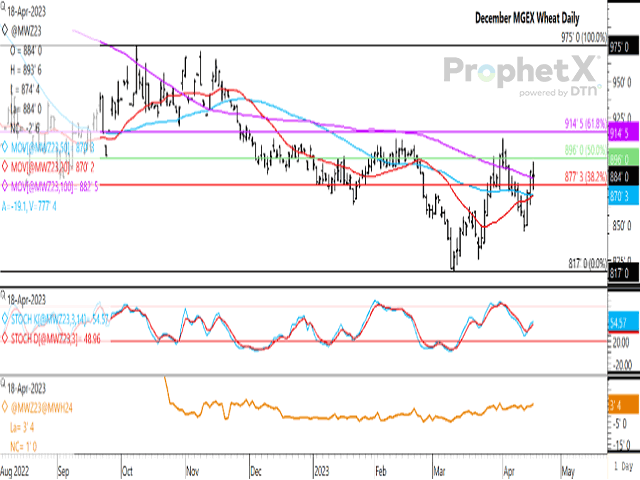
The December MGEX spring wheat contract settled 2 3/4 cents lower on April 18 at $8.84/bushel (bu), after trading both sides of the previous day's close. Today's trading bar on the daily chart shows a perfect doji bar or candlestick formed, with today's open of $8.84/bu equal to today's close, with buyers and sellers showing indecision and a neutral indicator overall given the close near the middle of the session's range.
Today's move saw the price remain above the contract's 100-day moving average for a second day, calculated at $8.82 1/2/bu. This is the first close above the 100-day since Nov. 23.
P[L1] D[0x0] M[300x250] OOP[F] ADUNIT[] T[]
Resistance on the chart is also seen at the horizontal green line at $8.96/bu, which represents the 50% retracement of the move from the contract's October high to March low. The December contract settled above this resistance on March 31 but has since failed to sustain a move above this line. A move above this resistance could clear the way for a continued move higher to the 61.8% retracement at $9.14 1/2/bu, which could also result in a test of the April 3 high of $9.10/bu.
Nearby resistance is also seen at psychological resistance at $9/bu, along with the April 3 high of $9.10/bu.
The brown line on the lower chart represents the Dec23/March24 contract spread, which strengthened 1/2 cent to 3 cents this session. Over the past 10 years, this spread has only been reported in inverted territory in one year on this date, or in 2022. Over the past five-years, this spread averaged minus 6.95 cents on this date, or a 6.95-cent carry, while averaging minus 9.2 cents over the past 10 years.
While not shown, the continuous December chart shows trade ranging from a high of $9.10/bu and a low of $8.17/bu since mid-December 2022, with today's close in the upper half of this range. A breach of the $9.10 level could result in an upside target of $10.03/bu, based on technical analysis theory.
Cliff Jamieson can be reached at cliff.jamieson@dtn.com
Follow him on Twitter @Cliff Jamieson
(c) Copyright 2023 DTN, LLC. All rights reserved.

Comments
To comment, please Log In or Join our Community .