

Canada Markets
Historical Change in the Seeded Acre Forecast
Ahead of the April 26 release of Statistics Canada's Principal field crop areas report, today's blog looks at the change in the seeded acre forecast from the unofficial Agriculture and Agri-Food Canada estimates released in January to the March intentions released in April. The change from the March intentions forecast to the final estimates shown in Statistics Canada tables is also calculated.
There are a number of factors that can affect the forecast for spring planting. One that jumps out is the potential for overland flooding in the Red River Valley, with the risk levels less clear during March when the seeded acre surveys were being conducted. Another factor is tendencies seen in Statistics Canada reporting; as stated by Mark Twain, "history doesn't repeat itself, but often it rhymes."
P[L1] D[0x0] M[300x250] OOP[F] ADUNIT[] T[]
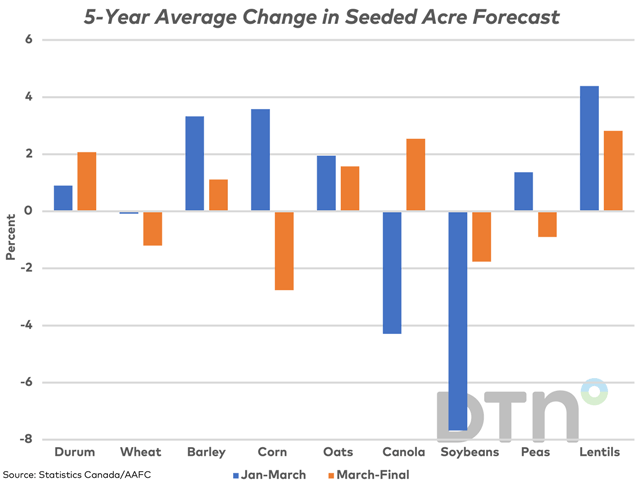
The blue bars on the attached chart shows the five-year average percent change from the unofficial Agriculture and Agri-Food Canada (AAFC) estimates released in January to the official Statistics Canada report released in April for select crops. As seen on the attached chart, the five-year average would indicate that the seeded acre forecast will increase in the March data in six of the nine crops.
The largest percentage increase is seen in lentils, with acres on average forecast 4.4% higher in April, while the largest percentage drop is seen for soybeans, where the acreage forecast based on March intentions fell by an average of 7.7% from the early unofficial estimate. The most consistency was seen in soybean forecasts, with the March forecast falling below the January unofficial forecast in each of the past five years, while corn acres have been forecast higher than the January estimate in four of the past five years.
The brown bars represent the average percent change from the March intentions forecast released in April to the final seeded acres reported by Statistics Canada data tables. Of the select crops, five of nine crops have averaged an upward revision from the April forecast to the final acres planted, raging from a 1.1% increase for barley acres to a further 2.8% increase for lentil acres.
Of the crops shown, acres for durum, barley, oats and lentils have increased from the initial January report to the March intentions report on average, while have been revised even higher in the data tables for final seeded acres. Acres for wheat and soybeans have been revised lower in April and then lower again when the final acres are tabulated.
Cliff Jamieson can be reached at cliff.jamieson@dtn.com
Follow him on Twitter @Cliff Jamieson
(c) Copyright 2023 DTN, LLC. All rights reserved.

Comments
To comment, please Log In or Join our Community .