

Canada Markets
Canadian Dollar Struggles to Sustain Upward Momentum
The spot Canadian dollar finished 38 basis points lower on Wednesday, its largest one-day drop since Feb. 21 or almost two months while reaching its weakest trade in five sessions. Today's trade also filled a gap in trade created from April 12 to 13, which failed to provide a supportive role. While not shown, the spot dollar continues to hold above support of its 100-day moving average, reported at $0.739487 CAD/USD.
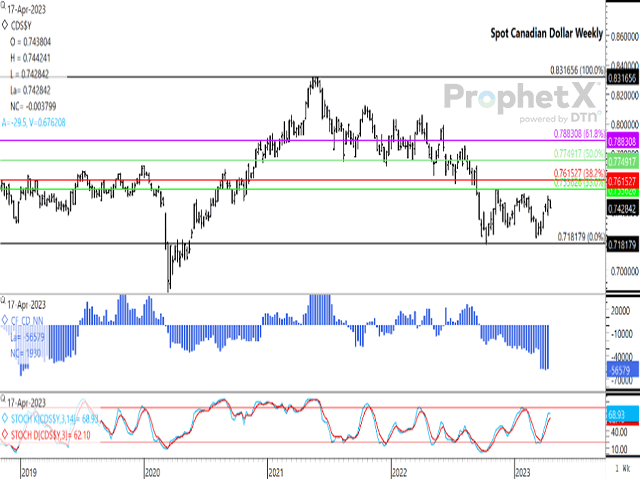
As seen on the weekly chart, trade has taken place over a 367 basis-point range since the week of Sept. 19. A high of $0.754922 CAD/USD was reached in the week of Nov. 7, with lower highs of $0.752344 CAD/USD reached during the week of Jan. 30 and more recently, a lower high of $0.750576 CAD/USD was reached during the week of April 10.
P[L1] D[0x0] M[300x250] OOP[F] ADUNIT[] T[]
At the same time, the chart shows lower lows reached, with the most recent weekly low reached at $0.722365 CAD/USD in the week of March 6.
The loonie is clearly struggling to reach a higher high on the weekly chart. The November high retraced close to the 33% level of the move from the May 2021 high to the October 2022 low, calculated at $0.755626 CAD/USD, while has since failed to return to this level.
The histogram on the first study shows the CFTC data for noncommercial positions, with the net-short position held by this group signaling the largest bearish position held since January 2019.
The stochastic momentum indicators on the lower study show signs of the indicators turning sideways.
Cliff Jamieson can be reached at cliff.jamieson@dtn.com
Follow him on Twitter @Cliff Jamieson
(c) Copyright 2023 DTN, LLC. All rights reserved.

Comments
To comment, please Log In or Join our Community .