Canada Markets
Saskatchewan Agriculture's 2023 Crop Planning Guide
The Saskatchewan government's Crop Planning Guide 2023 uses a number of assumptions to estimate returns for 30 different field crops for 2023, while providing a spreadsheet download so returns can be tailored using individual farm data.
The targeted yield for each crop is based on the five-year average of the 80th percentile of the yield achieved in each of the three soil zones, or described as the yield at which 80% of producers achieve a yield that is lower than the target yield.
The end result is a snapshot in time, with crop prices, interest rates and input costs fluctuating. On Jan. 10, Statistics Canada released its quarterly Farm Input Price Index for the third quarter of 2022. The farm input total index at 150.1 for the third quarter of 2022 is up 18.1% from one year ago, which includes a 47.2% year-over-year increase for the machinery fuel index and a 45.3% increase in the fertilizer index, including a 55% increase in the nitrogen index. Costs from farm to farm in 2023 will vary widely with the timing of management decisions surrounding purchases and sales.
P[L1] D[0x0] M[300x250] OOP[F] ADUNIT[] T[]
When compared to Statistics Canada's historical input data, the year-over-year quarterly change in this index has eased slightly from the previous quarter, or the second quarter of 2022, when the farm input total increased by 21.9% from the same quarter in 2021 to 151.9. This is of little consolation, with the year-over-year percent change in the third quarter index averaging 3.1% over the past 10 years.
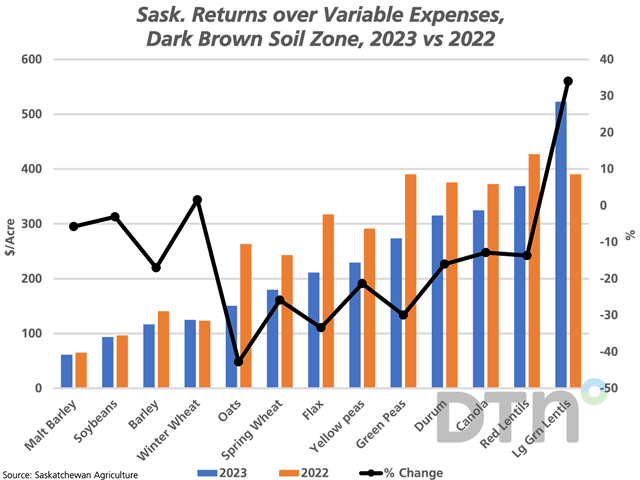
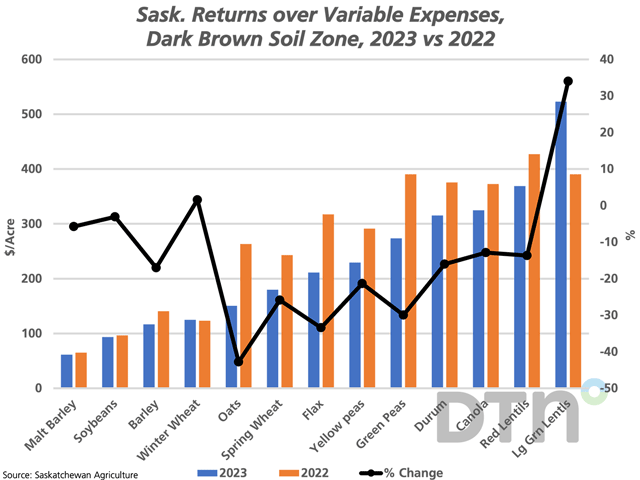
Of the crops in the provincial planner reported for each of the three soil zones, soybeans produced in the brown soil zone of the province is the only crop to result in a negative return over variable expenses, estimated at a loss of $7.87/acre. Malt barley shows the lowest return over variable expenses for the dark brown and black soil zones of all crops, at $61.31/acre and $102.45/acre, using a FOB farm price of $6.76/bushel or $310.49/mt.
The highest return over variable costs is shown for oriental mustard at $642.14/acre and $641.58/acre for large Kabuli chickpeas for the brown soil zone. The highest return is shown for large green lentils at $522.76 for the dark brown soil zone and $645.51/acre for quinoa in the black soil zone, followed by large green lentils at $464.26/acre.
When the government extends this calculation to a return over total expenses, government calculations show 10 crops of the 23 listed for the brown soil zone generating a positive return, along with nine of 19 crops in the dark brown soil zone and nine of 17 in the black soil zone.
Of the larger crops, durum is estimated to generate a positive return in both soil zones grown (brown and dark brown), while hard red spring wheat is estimated to generate a negative return ranging from $1.39/acre to $74.70/acre across the three soil zones. Canola calculations yield a positive return ranging from $55.42/acre to $144.84/acre across the three zones, while both large green lentils and red lentils are estimated to generate a positive return across the province.
Cliff Jamieson can be reached at cliff.jamieson@dtn.com
Follow him on Twitter @Cliff Jamieson
(c) Copyright 2023 DTN, LLC. All rights reserved.


Comments
To comment, please Log In or Join our Community .