

Canada Markets
March Canola Struggles With Resistance

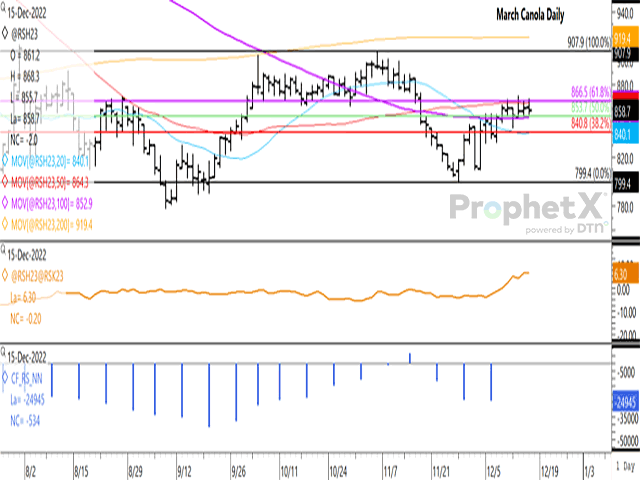
While not shown, a longer-term weekly chart will show March canola trading within a wide $146.60-per-metric-ton (mt) range since the week of June 20, or 25 weeks. The Dec. 15 close is just $7.50/mt above the midpoint of this range.
The daily chart accompanying this blog shows a narrower range of $26.10/mt traded over the past six sessions, with the Dec. 15 close of $858.70/mt landing just $0.95/mt above the midpoint of this range.
P[L1] D[0x0] M[300x250] OOP[F] ADUNIT[] T[]
In four of the past five sessions, the session's gain failed to sustain a move above resistance, which includes the past three sessions. This resistance is seen at $864.50/mt, the contract's 50-day moving average, as well as $866.50/mt, the 61.8% retracement of the move from the November high to the November low. It will take a move above these levels and the Dec. 13 high of $870.80/mt to signal the potential for a continued move higher.
The first study shows the March/May futures spread weakening $0.20/mt on Thursday to $6.30/mt, while continues to show this spread strengthening $4.30/mt so far this week while strengthening by $5.10/mt over the week prior. This inverse continues to reflect a growing bullish sentiment supporting prices, which is also seen in the May/July spread, which has also strengthened this week by $6.80/mt and to $6.80/mt after closing at even money last week (May equals the July, or spread of zero).
Weekly CFTC data will be updated on Dec. 16 for the week ended Dec. 13, which could see noncommercial traders once again pare their bearish net-short position for the week. As of Dec. 6, this group held the largest bearish position since the week of Oct. 4, or nine weeks.
Over four days of this week, the March contract is down a modest $2.20/mt, close to printing a third consecutive higher close on the weekly chart.
Cliff Jamieson can be reached at cliff.jamieson@dtn.com
Follow him on Twitter @Cliff Jamieson
(c) Copyright 2022 DTN, LLC. All rights reserved.
Comments
To comment, please Log In or Join our Community .