Canada Markets
Statistics Canada July 31 Grain Stocks
It is no surprise that Canadian grain stocks, as of July 31, are tight following the drought-reduced crop taken off in 2021.
When stocks of all crops reported for July 31 are added (excluding corn and soybeans), the total is 6.316 million metric tons (mmt), down 39.8% from July 2021 and 47.5% below the five-year average, while the lowest volume reported on this date in Statistics Canada's provided data back to 1980. Of this volume, 49% is wheat (excluding durum), 14% is canola and 9% is durum, the largest volumes seen across the grains.
Canada's all-wheat stocks were reported at 3.671 mmt, down 38.3% from last year and 41.1% below the five-year average. This is the lowest stocks reported in Statistics Canada data going back to 1980.
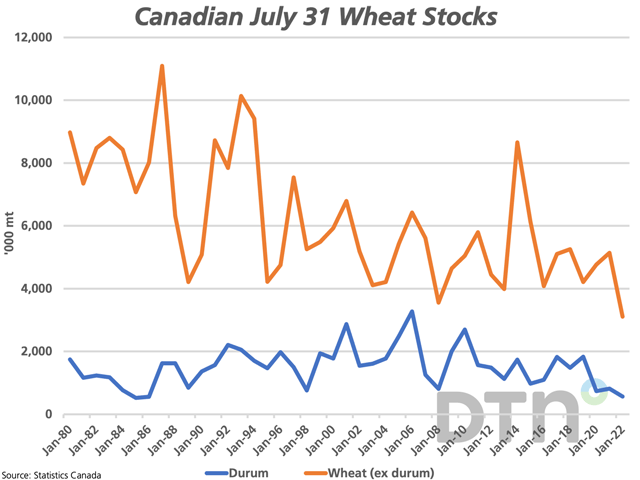
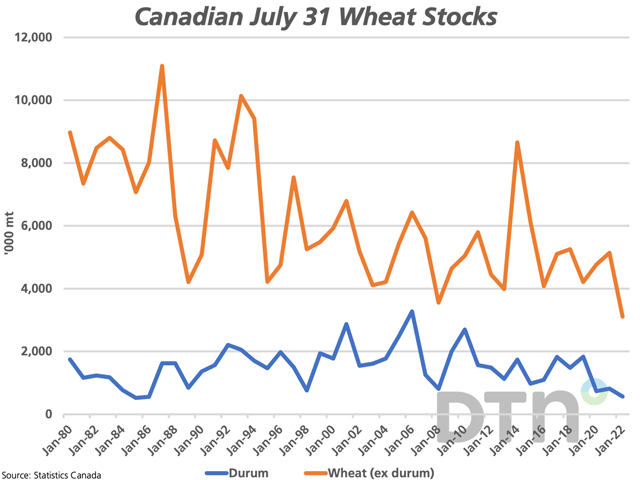
Wheat stocks excluding durum were reported at 3.106 mmt, down 39.6% from last year and 36.5% below the five-year average. This is also the lowest seen in data going back to 1980 and presents a challenge for Agriculture and Agri-Food Canada when it releases its next supply and demand estimates. Wheat stocks at 3.106 mmt are slightly below the AAFC's 3.2 mmt forecast, while Statistics Canada has recently added 514,206 mt of wheat (excluding durum) to its production forecasts for 2020 and 2021 combined. Watch for an upward revision to the feed use forecast needed to bring the 2021-22 forecast into balance.
P[L1] D[0x0] M[300x250] OOP[F] ADUNIT[] T[]
Durum stocks were estimated at 565,000 mt, down 30.5% from last year and 57.7% below the five-year average. As seen on the attached graphic, this is the lowest seen since July 1986. Once again, this is only slightly higher than AAFC's forecast of 496,000 mt, while Statistics Canada's prior-year adjustments saw an additional 383,994 mt of production added for 2021. Again, this will require an upward adjustment to feed use to bring the 2021-22 balance sheet into balance.
Canola stocks were reported at 875,000 mt, slightly above the 800,000 mt forecast by AAFC in their August forecast. This is down 50.7% from last year and 67.9% below the five-year average, while the lowest stocks on this date since 588,000 mt were carried out of 2012-13. Statistics Canada's most recent production estimates included an upward adjustment of 1.163 mmt to the 2021 crop, so the million-dollar question is where did this incremental volume go -- we know what was crushed and what was exported and it does not show up as higher ending stocks. It is also interesting to note that Statistics Canada found 242,000 mt on farm as of July 31, while producers delivered 279,900 mt of canola into the licensed handling system in the first two weeks of August, when very little, if any canola harvest taking place on the Prairies as of mid-August.
Dry pea stocks fell 31.1% to 385,100 mt, while 6.2% below the five-year average. This was higher than AAFC's stocks forecast at 250,000 mt. Lentil stocks were reported at 224,000 mt, down 48.9% from last year and 58.4% from the five-year average. This is also seen above AAFC's forecast that pegged stocks at 150,000 mt.
Oat stocks fell 51.6% from 2021 to 318,000 mt, which is down 46.3% from the five-year average and the lowest level of July 31 stocks seen in Statistics Canada data going back to 1980. This is higher than the 220,000 mt forecast in AAFC's August supply and demand tables, while close to 50% of this volume is seen on farms.
For a second consecutive year, barley stocks fell to an all-time low. Barley stocks were reported at 504,000 mt, down 29% from last year and 57.2% below the five-year average.
Today's tighter stocks were very much expected, with focus on the much larger harvest expected in 2022. As always, the challenge remains in estimating on-farm supplies, while the tighter stocks can be quickly mixed with new-crop deliveries, easing concerns surrounding the tighter stocks.
Cliff Jamieson can be reached at cliff.jamieson@dtn.com
Follow him on Twitter @Cliff Jamieson
(c) Copyright 2022 DTN, LLC. All rights reserved.


Comments
To comment, please Log In or Join our Community .