Canada Markets
Week 43 Deliveries as a Percent of Available Supplies
Week 43 deliveries or deliveries for the week ending May 30 for all crops into licensed facilities total 1.0237 million metric tons, or the largest volume delivered in four weeks as spring seeding reaches an end, May contracts are cleaned up and early deliveries on June contracts begin.
Of this volume, 77% consisted of wheat and canola deliveries. Wheat deliveries (excluding durum) were reported at 490,500 metric tons, the largest volume reported in five weeks, while the 296,900 mt of canola delivered was the largest volume seen in four weeks.
Cumulative deliveries of all crops into licensed facilities totals 56.1894 mmt as of May 30, up 9.4% from last year and 16.7% higher than the three-year average.
P[L1] D[0x0] M[300x250] OOP[F] ADUNIT[] T[]
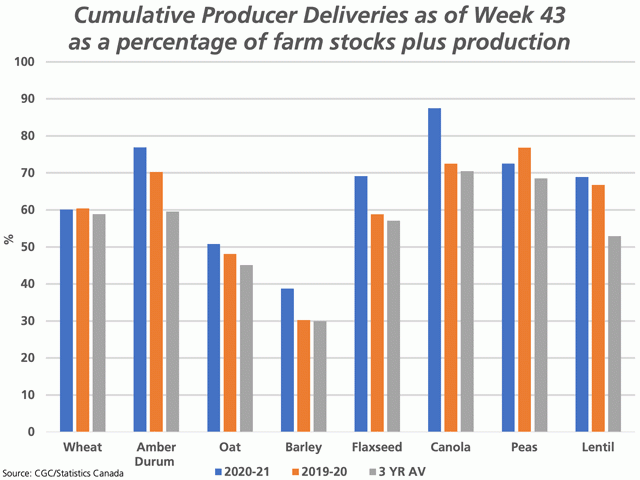
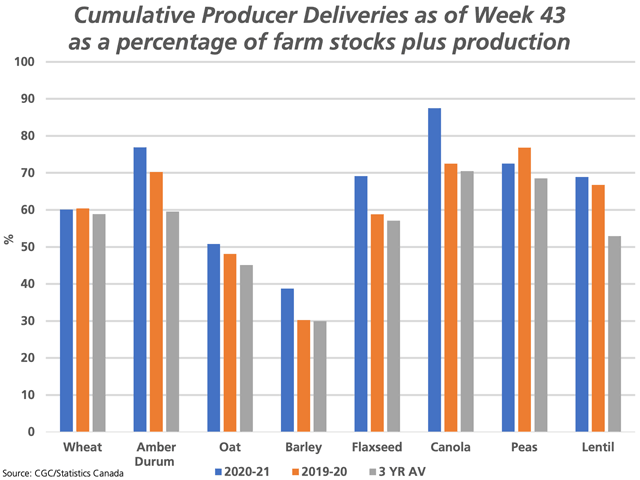
Current forecasts point to extremely tight stocks for several crops at the end of the crop year, or as of July 31. Today's study looks at cumulative deliveries of select crops into licensed facilities during the first 43 weeks or 83% of the crop year, calculated as a percentage of available supplies. In this case, available supplies are defined as a sum of Statistics Canada's July 31, 2020 farm stocks estimate and Statistics Canada's 2020 production estimate. This percentage (blue bar) is compared to the same period for the 2019-20 crop year (brown bar) and the three-year average (grey bar).
For example, based on Statistics Canada's farm stocks estimate for canola for July 31, 2020 and their production estimated for 2020, this study shows that producers have delivered 87.5% of the canola stocks available for delivery as of week 43, the highest percentage calculated across the select crops. This compares to 72.5% of available canola stocks delivered in the same period in 2019-20 and a three-year average of 70.5%.
The remaining 12.5% of the available canola supplies totals 2.6 mmt, which will be delivered over the remaining nine weeks while the balance will become ending farm stocks for 2020-21. This volume includes priced and unpriced grain, which points to the challenges faced by buyers in originating uncommitted grain over the balance of the crop year. If one considers volumes contracted for June and July delivery, one could conclude there is very little uncommitted seed remaining.
Other crops where current crop year deliveries represent a higher percentage of available supplies than seen in 2019-20 and the three-year average includes durum, oats, barley, canola, and lentils.
It should be noted that the low percentage shown for barley has no bearing on the level of ending stocks due to the high volume of deliveries into feed channels, or outside of the licensed handling system. To-date, 38.7% of available supplies have been delivered into the licensed handling system, which is well above the 30.2% calculated for this period in 2019-20 and the three-year average of 29.9%. While this percentage is well below the percentage discussed for canola, stocks of barley remain on track to reach record lows when combined with the movement into feed markets.
Cliff Jamieson can be reached at cliff.jamieson@dtn.com
Follow him on Twitter @Cliff Jamieson
(c) Copyright 2021 DTN, LLC. All rights reserved.


Comments
To comment, please Log In or Join our Community .