
Ag Weather Forum
SOI El Nino Trade Wind Update: How Intense Compared to Past?
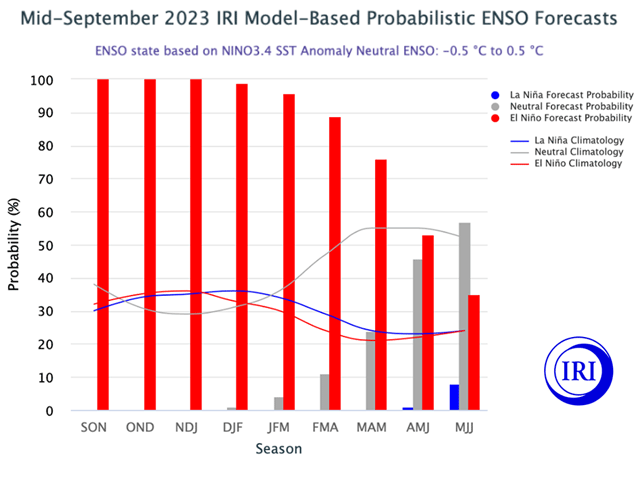
There has been much discussion recently about the prospect of El Nino in the Pacific Ocean reaching so-called "super" status and rivaling the intensity of the strongest El Nino events of the past 40 years. Those events are 1982-83, 1997-98 and 2015-16.
A look at the atmospheric component of El Nino, measured by the Southern Oscillation Index (SOI), shows that this year's El Nino is strengthening, but still trails the big three events. That's not surprising, because the monthly SOI values only reached the El Nino threshold in August. During the past three months, the monthly SOI readings and their El Nino indications are: July -3.32 (Neutral); August -10.85 (El Nino) and September -13.87 (El Nino).
From the U.S. Climate Prediction Center: "The Southern Oscillation Index (SOI) is one measure of the large-scale fluctuations in air pressure occurring between the western and eastern tropical Pacific (i.e., the state of the Southern Oscillation) during El Nino and La Nina episodes.
P[L1] D[0x0] M[300x250] OOP[F] ADUNIT[] T[]
"Traditionally, this index has been calculated based on the differences in air pressure anomaly between Tahiti and Darwin, Australia. In general, smoothed time series of the SOI correspond very well with changes in ocean temperatures across the eastern tropical Pacific. The negative phase of the SOI represents below-normal air pressure at Tahiti and above-normal air pressure at Darwin. Prolonged periods of negative SOI values coincide with abnormally warm ocean waters across the eastern tropical Pacific typical of El Nino episodes. Prolonged periods of positive SOI values coincide with abnormally cold ocean waters across the eastern tropical Pacific typical of La Nina episodes."
The Australia Bureau of Meteorology (BOM) has monitored the SOI for almost 140 years. The BOM's latest comment on the Pacific Ocean conditions noted that "Overall, there are signs that ... coupling of the ocean (temperatures) and atmosphere has started to occur," the BOM report said. "This coupling is a characteristic of an El Nino event and is what strengthens and sustains an event for an extended period."
Comparing those monthly SOI values for the El Nino events of 1982-83, 1997-98 and 2015-16 to this year's values, 2023 is trailing a bit. Going back to 1982, the July/August/September SOI values were -17.9, -22.2 and -20.0. The July/August/September SOI numbers in 1997 were -8.86, -18.7 and -14.12. And in 2015, the July/August/September SOI calculations came out to -13.83, -19.02 and -16.06. An overview of these numbers does indicate that the 2023 El Nino is intensifying. The 2023 September SOI reading of -13.87 is not far off the 1997 September reading.
El Nino is forecast to remain in effect at least through the spring season of 2024. Besides the weather pattern impact of El Nino around the globe, climate scientists will also be monitoring the possible push of world temperatures to more than 1.5 degrees Celsius (2.7 degrees Fahrenheit) above the pre-industrial levels of the mid to late 1800s for the first time on record.
SOI values can be accessed here: https://www.longpaddock.qld.gov.au/…
Bryce Anderson can be reached at Bryce.Anderson@dtn.com
Follow him on X, formerly known as Twitter, @BAndersonDTN
(c) Copyright 2023 DTN, LLC. All rights reserved.

Comments
To comment, please Log In or Join our Community .