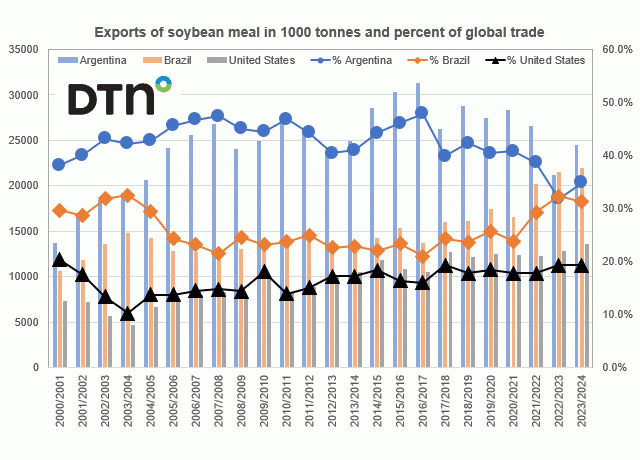
Exports of soybean meal from the three largest world shippers and their percent of global trade.

Exports of soybean meal from the three largest world shippers and their percent of global trade.
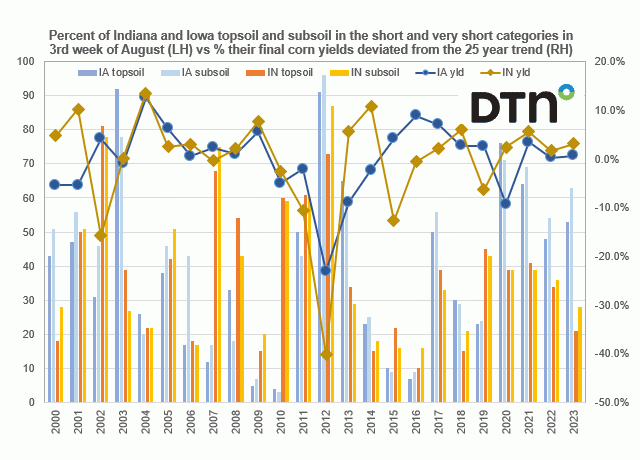
Percent of Indiana and Iowa topsoil and subsoil in the combined short and very short categories in third week of August vs. percent that their final corn yields deviated from the 25-year trend.
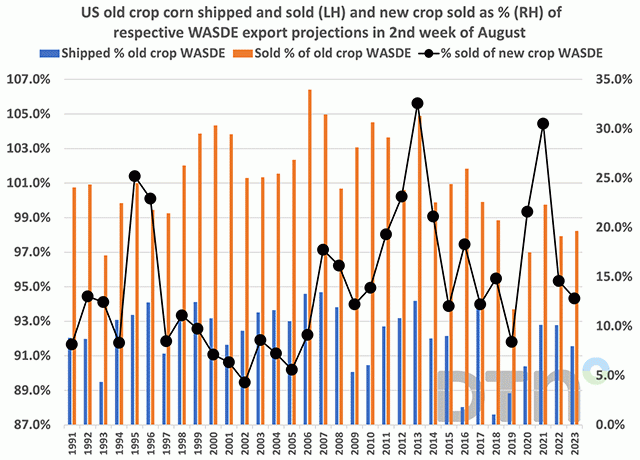
The pace of U.S. corn exports has been quite sluggish for some time with the USDA posting several downward revisions for the 2022/23 marketing year over the past few months and again in this month's WASDE report.

The pace of U.S. corn exports has been quite sluggish for some time with the USDA posting several downward revisions for the 2022/23 marketing year over the past few months and again in this month's WASDE report.
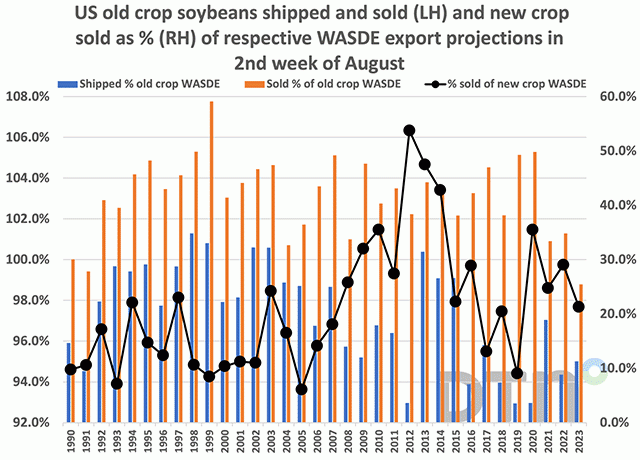
The U.S. has been selling China quite a few soybeans in recent weeks as the PRC is reacting to rising Brazilian FOB premiums as their harvest winds down, congestion at some of the Brazilian ports and uncertainty as to how large the U.S. crop this fall will be.
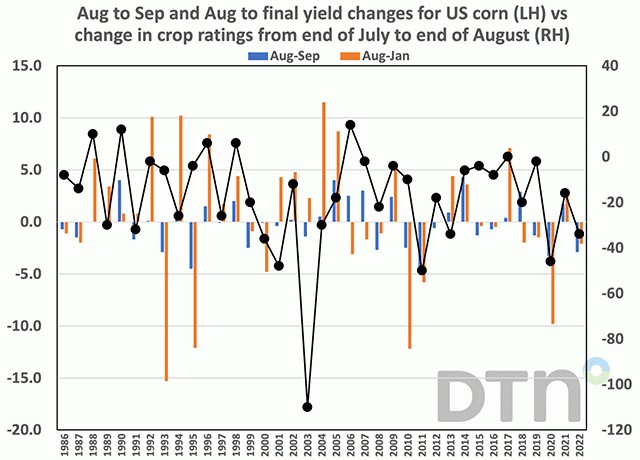
The USDA August 14, 2023, crop progress report contained corn and soybean condition improvements signaling a potential yield increase.
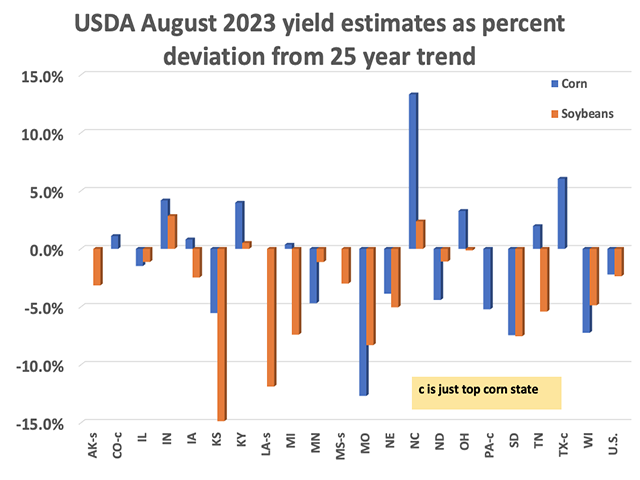
The USDA August crop production report contained average corn and soybean yields a tad below average trade guesses but not too much out of line.
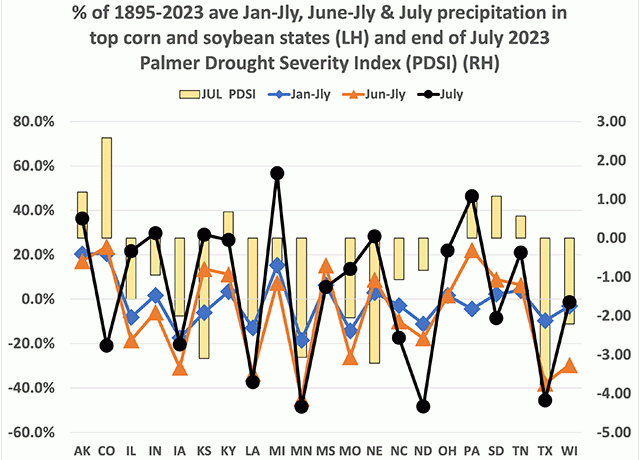
Dry or even drought conditions appear to be the real culprit affecting corn and soybean condition ratings.
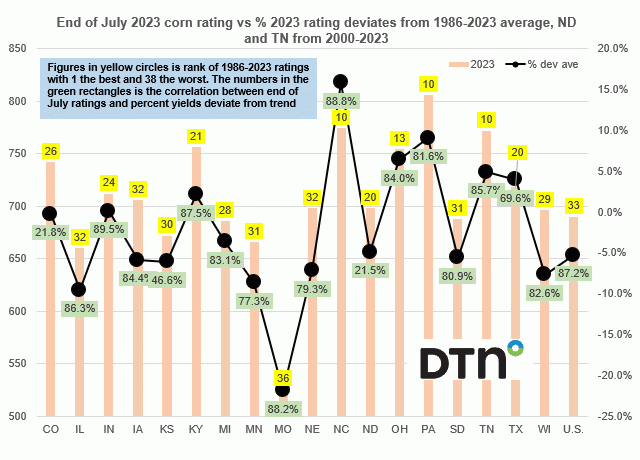
End of July 2023 crop ratings for the top 18 corn producing states and the U.S. vs. the percent that the 2023 rating deviates from the 1986-2023 end of July rating average
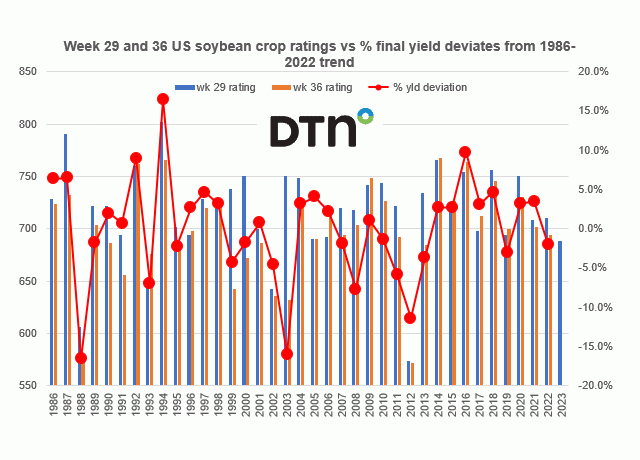
U.S. soybean crop ratings as of week 28 and then on week 36, and after the critical growing month of August vs. the percent that the final yield deviated from the 1986-2022 trend.
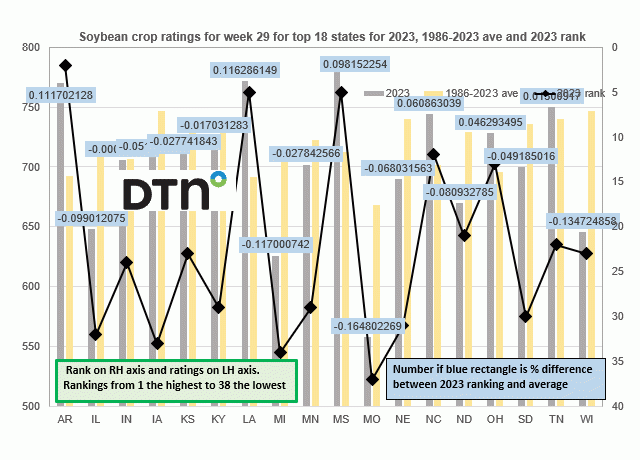
Soybean crop ratings for week 29 for the top 18 producing states for 2023, the 1986-2023 average and where this year's week 29 rating ranks for the complete week 29 history from 1986 to 2023
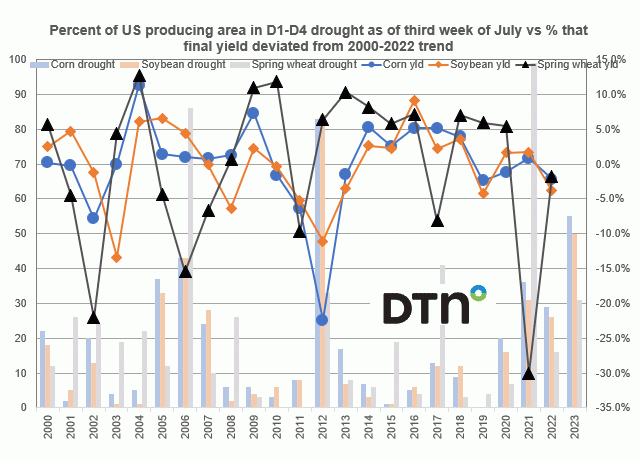
Percent of the U.S. corn, soybean and spring wheat producing area in D1-D4 drought as of third week of July vs. the percent that the final yield of each of these crops deviated from the 2000-2022 trend.
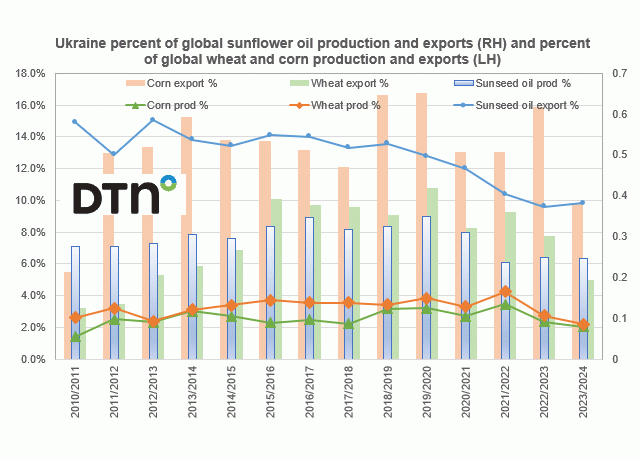
Ukraine's percent of global sunflower oil production and exports vs. its percent of global wheat and corn production and exports on the left hand-axis.
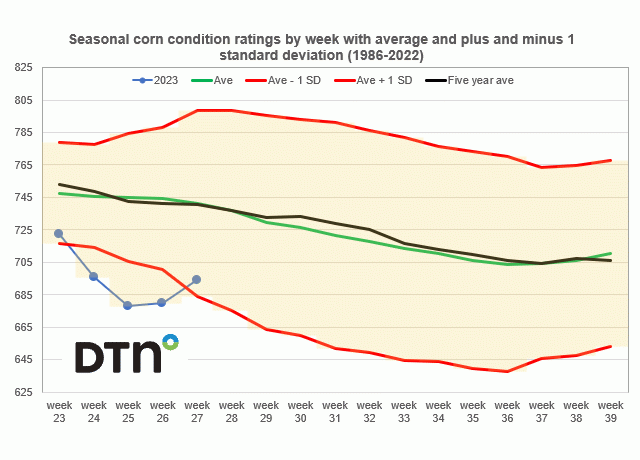
The seasonal corn condition ratings by week with the average and plus and minus one standard deviation lines using data from 1986 to 2022 vs. the five-year average and the weekly crop ratings so far for 2023.
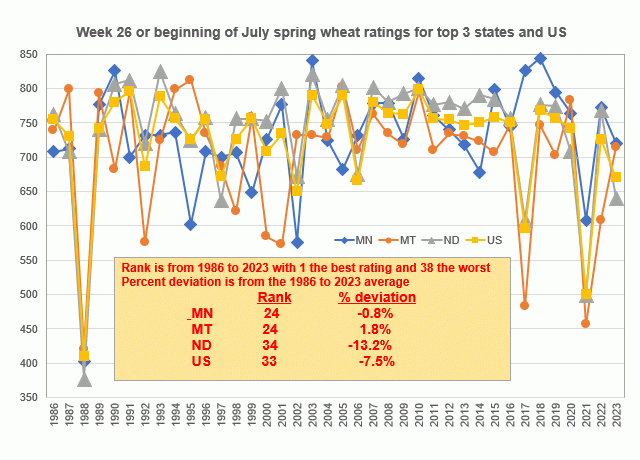
This chart shows the week 26 (or around the beginning of July) spring wheat ratings for the top three producing states and the U.S. figure is also included.
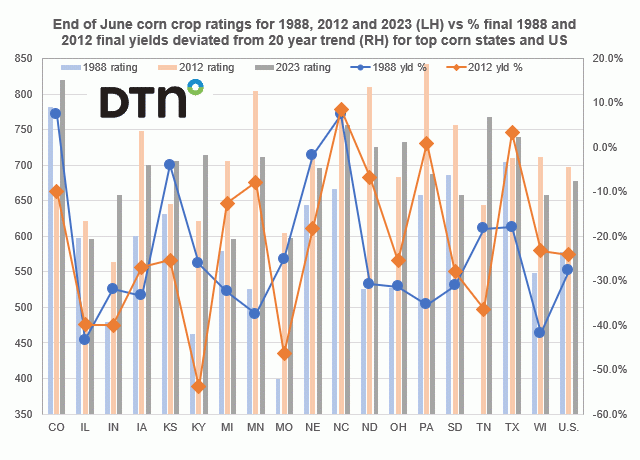
End of June corn crop ratings for 1988, 2012 and 2023 vs. the percent that the final 1988 and 2012 corn yields deviated from the 20-year trend for the top 18 producing states and the U.S.
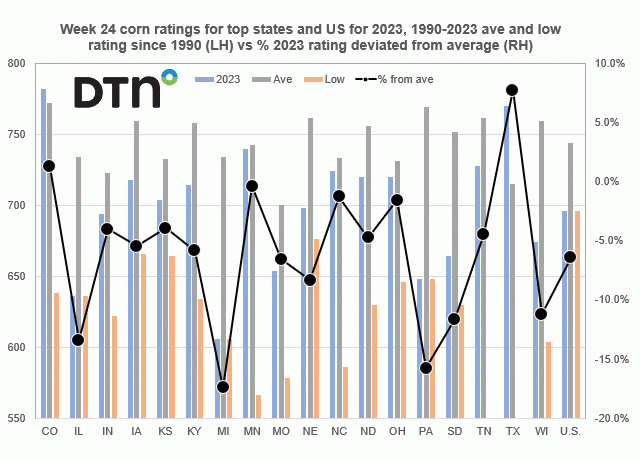
Week 24 corn ratings for the top 18 corn producing states and U.S. for 2023, the 1990-2023 average and low rating since 1990 vs. the percent that the 2023 week 24 rating deviated from the 1990-2023 average.
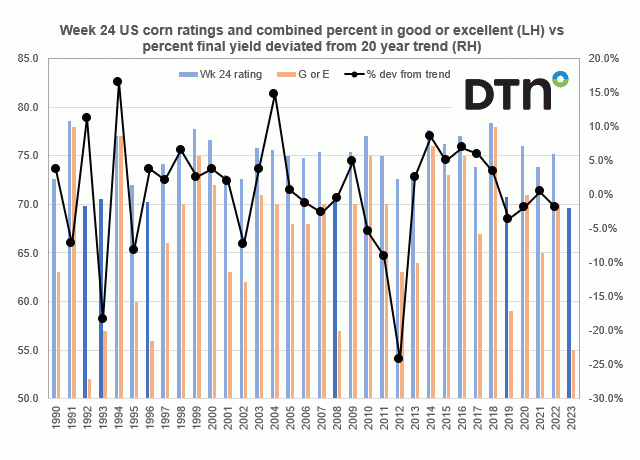
This chart shows the USDA corn condition report using of our usual ratings system and the percent that the final U.S. corn yield that year deviated from the 20-year trend vs. the combined percent of the U.S. corn crop rated in either the good or excellent category.
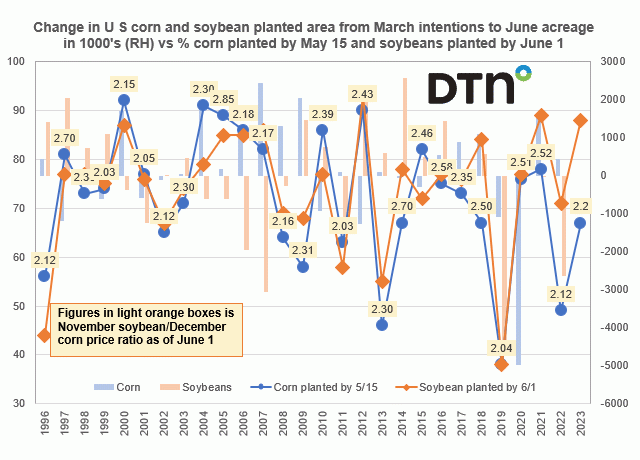
Change in U.S. corn and soybean planted area from the March intentions to June acreage report vs the percent of corn planted by May 15 and soybeans planted by June 1
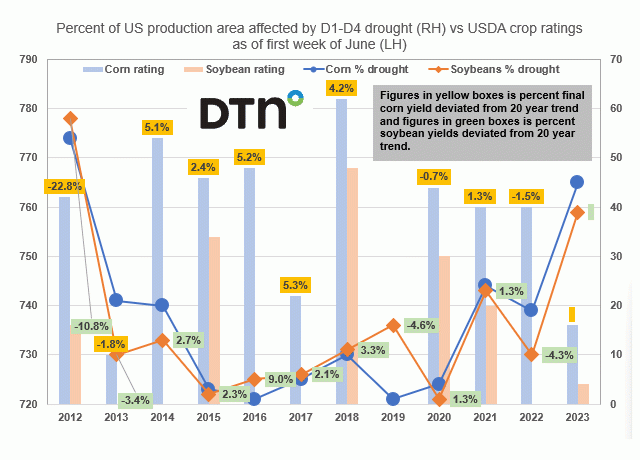
USDA corn crop and soybean crop conditions as of the first week of June vs. percent of corn and bean area in drought as of the first week of July in the serious drought year of 2012.
DIM[2x3] LBL[blogs-fundamentally-speaking-list] SEL[[data-native-ad-target=articleList]] IDX[2] TMPL[news] T[]
DIM[2x3] LBL[blogs-fundamentally-speaking-list-2] SEL[[data-native-ad-target=articleList]] IDX[5] TMPL[news] T[]