Fundamentally Speaking
US Seeing 6th Worst Corn Ratings since 1986
USDA will release this year's first crop production report on Friday though it will be based on satellite imagery and farmer assessments with actual field measurements done for the September report.
Seeing a lot of trade estimates come in and they are circulating near 175 bushels per acre (bpa) for corn and 51 for soybeans vs last month's USDA projections of 177.5 and 52 respectively, both records by the way.
Many of the yield projections are based on end of July crop ratings which this year have not been too spiffy linked to weather challenges earlier in the season.
P[L1] D[0x0] M[300x250] OOP[F] ADUNIT[] T[]
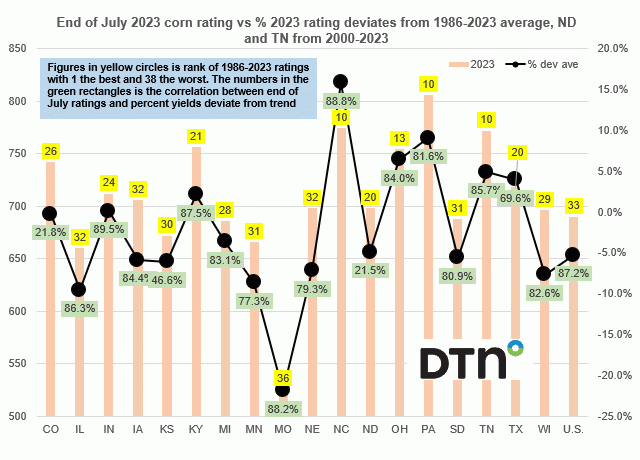
Using our usual ratings system where we weight the crop based on the percent in each category and assign that category a factor of 2 for very poor, 4 for poor, 6 for fair, 8 for good, and 10 for excellent and then sum the results, this chart shows the end of July 2023 crop ratings for the top 18 producing states and the U.S. on the left hand axis while the percent that the 2023 rating deviates from the 1986-2023 end of July rating average is plotted on the right-hand axis.
The figures in the yellow circles are the rank of 1986-2023 ratings with 1 the best and 38 the worst, while the numbers in the green rectangles are the correlation between end of July ratings and percent yields deviate from trend using 1986-2022 data, with exception of North Dakota and Tennessee where 2000-2022 data is used.
As noted, this has not been the best of growing seasons up to the end of July with the U.S. rank of 33 meaning this year's end of July ratings is the sixth worst since ratings began in 1986 and only four states NC, OH, PA and TN have above average ratings, but none rank even in the top quarter.
The lowest ratings are in Missouri which has been mired in severe drought conditions much of the spring and summer as that state has its third worst end of July corn rating ever at 22% below its average.
IL, IA, MN, NE, SD and WI also do not fare too well in this regard and have some of their lowest rated crops going back to 1986.
We should mention that end of July ratings are a pretty good explanatory variable for percent deviation from final yields as correlations for most states at least 85% or higher.
(c) Copyright 2023 DTN, LLC. All rights reserved.


Comments
To comment, please Log In or Join our Community .