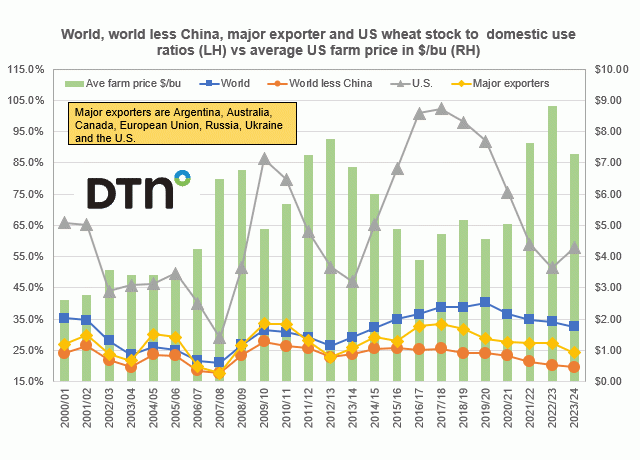
by
Joel Karlin
,
DTN Contributing Analyst
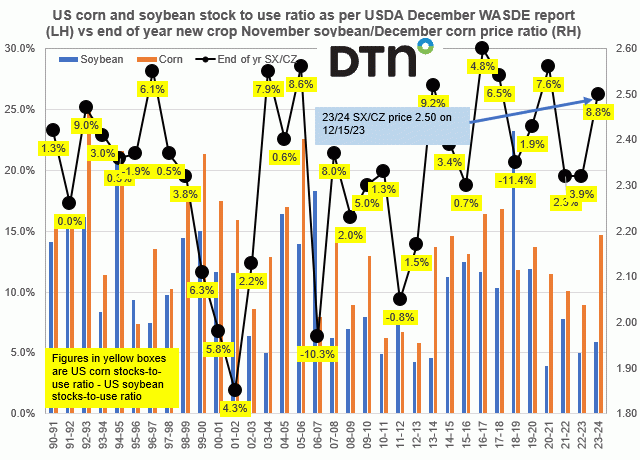
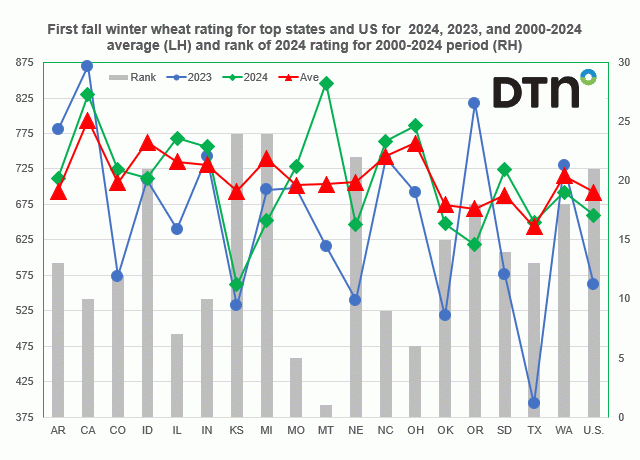
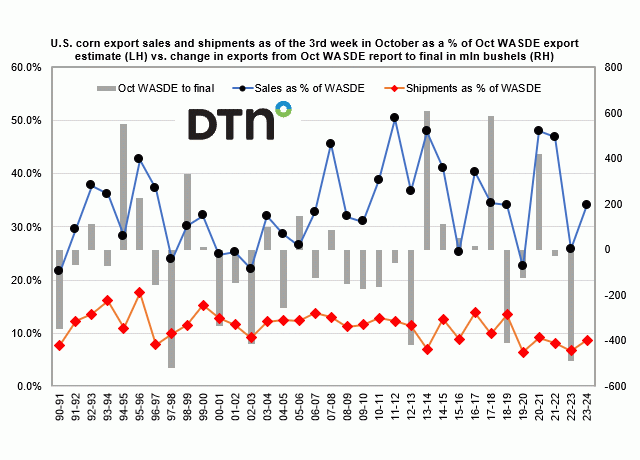
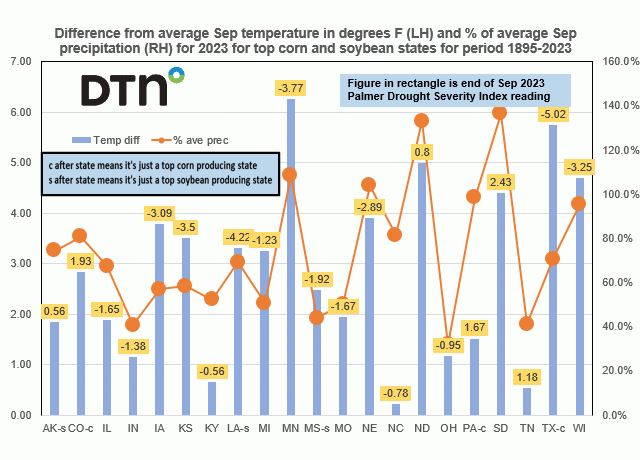
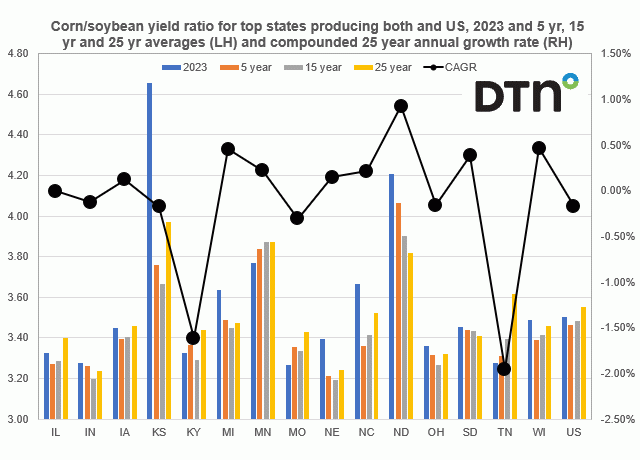
Corn/soybean yield ratios for the top 15 states that produce both and the U.S. for this past season based on the November crop report and their respective five-, 15- and 25-year averages vs. the trend in that ratio for these states