

Fundamentally Speaking
U.S. & Top State Corn Conditions
Corn market action has been a little perky of late reflecting a bounce from technically oversold conditions, the realization that the funds are probably short close to 100,000 contracts and some evening up of positions ahead of the September 12 crop production figures.
With regard to the upcoming USDA report, sentiment seems to be the U.S. corn yield may not change significantly from the 169.5 bushel per acre (bpa) projection given last month.
An examination of crop conditions as of September 1 would seem to corroborate this contention with U.S. crop ratings actually slightly above average implying trend yields that for this year are seen in the 168-169 bpa range.
P[L1] D[0x0] M[300x250] OOP[F] ADUNIT[] T[]
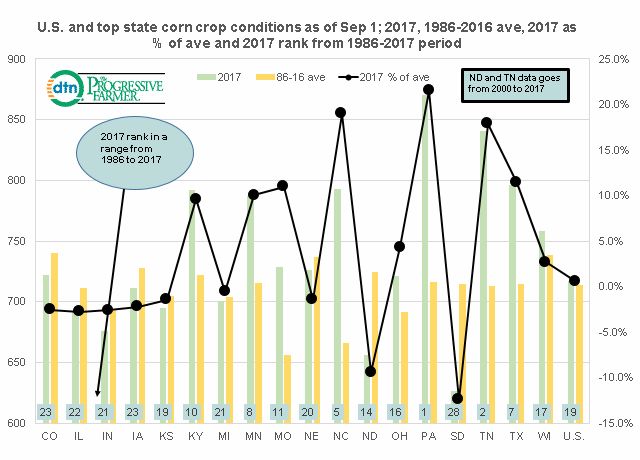
This graphic shows the U.S. and top 18 state crop conditions as of September 1st for this year, the 1986-2016 average, 2017 as a percent of that average and where 2017 ranks for the period 1986-2017.
Crop conditions are measured using our usual ratings system where we weight the crop based on the percent in each category and assign that category a factor of 2 for very poor, 4 for poor, 6 for fair, 8 for good, and 10 for excellent and then sum the results.
In looking at the national figure the Sep 1, 2017 U.S. corn rating of 717 is a mere 0.6% above the 1986-2016 average of 713 with a rank of 19 out of the 32 years' worth of data.
States outside the core Midwest region seem to have fared best this year with Pennsylvania leading the pack with its highest ranking ever as of September 1 with current crop conditions a whopping 21.5% above the 1986-2016 average.
Tennessee has also fared well with its second best ranking and crop ratings 17.9% above the average though North Carolina is even higher at 19% above the average.
On the other hand, South Dakota has the lowest rating of 626 and this is the fourth lowest ranking since 1986 as they are 12.4% below their average with North Dakota having a rating of 656 which is 9.4% below its average.
Other than these two states the current crop ratings imply no real disaster which could result in final corn yields very close to the USDA's August 2017 projection.
(KA)
© Copyright 2017 DTN/The Progressive Farmer. All rights reserved.

Comments
To comment, please Log In or Join our Community .