

Technically Speaking
Monthly Analysis: Livestock Markets

Live Cattle: The August contract closed at $116.30, down $5.40 on the monthly chart. The market remains in a major (long-term) 5-Wave uptrend that began at the end of October 2016 with a bullish crossover by monthly stochastics below the oversold level of 20%. With stochastics still bullish below the overbought level of 80%, initial resistance is near $125.375, a price that marks the 38.2% retracement level of the previous downtrend from $171.975 (November 2014) through the November 2016 low of $94.30. However, the market's secondary (intermediate-term) downtrend has resulted in a test of support between $115.325 and $110.80.
P[L1] D[0x0] M[300x250] OOP[F] ADUNIT[] T[]
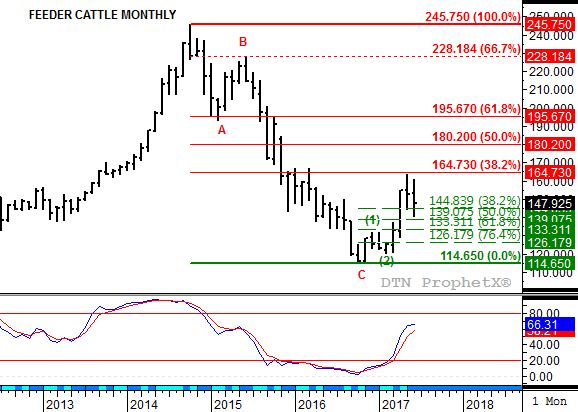
Feeder Cattle: The August contract closed at $147.925, down $4.65 on the monthly chart. Despite the lower monthly close the market remains in major (long-term) 5-wave uptrend. The market's secondary (intermediate-term) downtrend looks to be Wave 4 with support at $133.30 expected to hold. The Wave 1 high was $131.75. Monthly stochastics remain bullish, still well below the overbought level of 80%.
Lean Hogs: The August contract closed at $83.75, up $1.575 on the monthly chart. Lean hogs remain in a major (long-term) uptrend, posting a new 4-month high of $83.75 during June. Next resistance is near $87.075, a price that marks the 50% retracement level of the previous downtrend from $133.425 through the low of $40.70. Monthly stochastics are bullish, but approaching the overbought level of 80%.
Corn (Cash): The DTN National Corn Index (NCI.X, national average cash price) closed at $3.34 3/4, down 1/2 cent for the month. The major (long-term) trend of the NCI.X remains difficult to classify. The best description could be a long-term sideways trend between the low of $2.81 1/2 (October 2014) and $4.10, a price that marks the 23.6% retracement level of the previous downtrend from $8.26 1/4 (August 2012). The NCI.X posted an outside monthly (above the previous month's high, below the previous month's low) below closing fractionally lower for the month. This is a bearish sign that would indicate a possible test of major (long-term) support. However, the NCI.X did post a new 4-month high of $3.48 indicating a test of resistance should be the next move. Continue to watch the cash corn market closely.
Soybean meal: The more active December contract closed at $311.20, down $13.10 on the continuous monthly chart. Soybean meal's major (long-term) chart remains a difficult read. The last major signal by stochastics was a bullish crossover below the oversold level of 20% at the end of March 2016, signaling the beginning of an uptrend. The sell-off from the June 2016 high of $432.50 through this past month's low of $292.00 amounted to a 76.4% retracement back to $299.90, with the more active December contract closing back above this support level. Given these indicators, the major trend could still be classified as up. The market needs to be closely watched.
To track my thoughts on the markets throughout the day, follow me on Twitter: www.twitter.com\DarinNewsom


Comments
To comment, please Log In or Join our Community .