

Technically Speaking
Weekly Analysis: Livestock Markets
Live Cattle: The August contract closed $7.10 higher at $126.05. August live cattle are showing a number of different technical patterns. Both the daily (short-term) and weekly (intermediate-term) charts are nearing potential double-top formations with the previous high of $127.50. The contract remains overbought on both daily and weekly charts with stochastics above the 80% level. This would suggest the next move should be down. However, the market's major (long-term) trend remains up (see the blog post from June 1). A move through the previous high on the weekly chart would indicate an extension of the major uptrend to next resistance on the monthly chart at $134.425. This type of move looks to be more likely given last week's bullish outside range.
P[L1] D[0x0] M[300x250] OOP[F] ADUNIT[] T[]
Feeder Cattle: The August contract closed $11.775 higher at $158.725. August feeders are similar to August live cattle in nearly every respect. The contract posted a bullish outside range last week, indicating it could move through its previous high of $163.50 rather than establish a secondary (intermediate-term) double-top formation. If so its major (long-term) uptrend on the market's monthly could extend to near $172.50.
Lean Hogs: The August contract closed $0.40 higher at $81.70 last week. After spiking to a new high of $82.70, August lean hogs closed only marginally higher for the week. Weekly stochastics show the contract to be overbought once again, possibly leading to another bearish crossover. Major (long-term) resistance on the market's monthly chart is near $87.05, a price that marks the 50% retracement level of the previous downtrend from $133.425 through the low of $40.70.
Corn (Cash): The DTN National Corn Index (NCI.X, national average cash price) closed at $3.35 1/2, down 1 1/2 cents for the week. Cash corn continues to show sideways trends on its major (long-term) monthly, secondary (intermediate-term) weekly, and minor (short-term) daily charts. Resistance on its weekly close only chart is at $3.43 with support at $3.18 1/4.
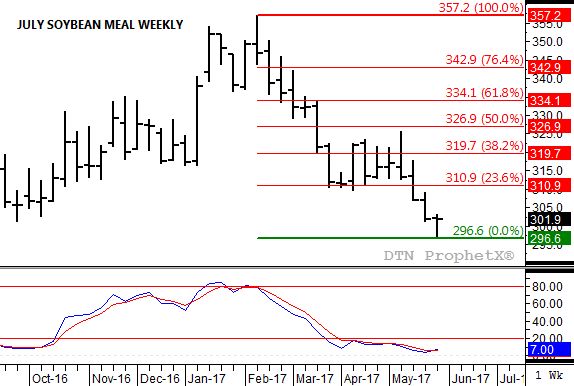
Soybean meal: The July contract closed $0.10 higher at $301.90. July bean meal looks to have posted a spike reversal last week, indicating its secondary (intermediate-term) trend has turned up. After posting a new low of $296.60 the contract was able to close higher for the week and back above major (long-term) support on its monthly chart at $299.90. Also, weekly stochastics posted another bullish crossover below the oversold level of 20% with both lines in single-digits. If the secondary trend has indeed turned up, initial resistance is between $310.90 and $319.70. These prices mark the 23.6% and 31.8% retracement levels of the previous downtrend from $357.20 through last week's low.
To track my thoughts on the markets throughout the day, follow me on Twitter: www.twitter.com\DarinNewsom


Comments
To comment, please Log In or Join our Community .