

Technically Speaking
Weekly Analysis: Corn and Soybean Markets

Corn (Cash): The DTN National Corn Index (NCI.X, national average cash price) closed at $3.35 1/2, down 1 1/2 cents for the week. Cash corn continues to show sideways trends on its major (long-term) monthly, secondary (intermediate-term) weekly, and minor (short-term) daily charts. Resistance on its weekly close only chart is at $3.43 with support at $3.18 1/4.
Corn (Old-crop Futures): The July contract closed 1.50cts lower at $3.72 3/4. The secondary (intermediate-term) trend remains sideways with initial support at $3.60 1/2 and resistance at the high of $3.79 1/2. Based on the 19 cent sideways range, a move through resistance would indicate an extended rally to test resistance at $3.98 1/4 while a move through support implies a retest of the low at $3.60 1/4.
P[L1] D[0x0] M[300x250] OOP[F] ADUNIT[] T[]
Corn (New-crop Futures): The December 2017 contract closed 1.50cts lower at $3.91. The contract's secondary (intermediate-term) trend remains sideways. However, unlike the DTN National Corn Index and old-crop July, new-crop December is showing a series of ascending lows putting support at $3.81 1/2 this week. Given this pattern the contract looks more bullish, meaning a higher likelihood of seeing a breakout of the high-side of its trading range at $3.95 3/4. If so Dec corn would be expected to test the previous set of highs near $4.03 3/4.
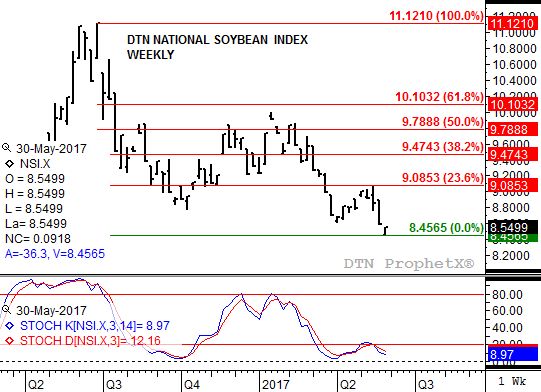
Soybeans (Cash): The DTN National Soybean Index (NSI.X, national average cash price) closed at $8.55, down 4 1/2 cents for the week. Despite the lower weekly close, cash soybeans look to be in position to establish a possible secondary (intermediate-term) uptrend this week. Last week saw the NSI.X leave a bearish gap between the previous week's low of $8.59 1/2 and last week's high of $8.55. However, since the contract closed at its weekly high a bullish price gap is possible this coming week if the cash market posts a strong rally Monday. If so this would create an island bottom reversal. Furthermore, weekly stochastics are below the oversold level of 20% and in position to establish another bullish crossover.
Soybeans (Old-crop Futures): The July contract closed at $9.21 1/4, down 5 1/4 cents for the week. Despite moving to a new low of $9.09 1/2 last week and posting a lower weekly close, the fact July beans were able to rally late opens the door for last week's pattern to be viewed as a potential spike reversal. However, the first step towards actually indicating a possible secondary (intermediate-term) uptrend on its weekly chart would be a bullish crossover by weekly stochastics below the oversold level of 20%. Last Friday saw both the faster moving blue line and slower moving red line finish the week in single-digits, setting the stage for a potential crossover this week.
Soybeans (New-crop Futures): The November 2017 contract closed at $9.25 1/2, down 3 3/4 cents for the week. Similar to old-crop July, new-crop November looks to have established a possible bullish spike reversal as it rallied late last week off its test of support at $9.19. This price marks the 67% retracement level of the previous secondary uptrend from $8.57 through the high of $10.43. Weekly stochastics are well below the oversold level of 20% and in position for a bullish crossover.
To track my thoughts on the markets throughout the day, follow me on Twitter: www.twitter.com\DarinNewsom
Comments
To comment, please Log In or Join our Community .