

Technically Speaking
Monthly Analysis: Livestock Markets
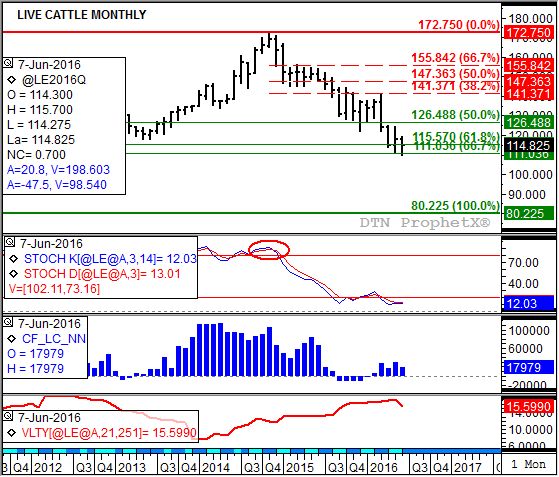
Live Cattle: The August contract closed at $114.825, down $3.225 on the monthly chart. Live cattle are an interesting technical study. While the major (long-term) trend remains down, August live cattle were able to rally off support at $111.025. This price marks the 67% retracement level of the previous uptrend from $80.225 (March 2009) through the high of $172.75 (November 2014), seems to have held. Monthly stochastics remains below the oversold level of 20%, in position for a potential bullish crossover.
P[L1] D[0x0] M[300x250] OOP[F] ADUNIT[] T[]
Feeder Cattle: The August contract closed at $144.20, down $2.80 on the monthly chart. The market posted a new Wave C low of $134.25 in June before rallying late in the month. This was a test of support near $183.825, a price that marks the 67% retracement level of the previous uptrend from $85.45 (December 2008) through the high of $245.75 (October 2014).
Lean Hogs: The August contract closed at $83.275, up $1.825 on the monthly chart. The market remains in a major (long-term) uptrend, though it seems to be losing bullish momentum. If the contract starts to pull back, the June high of $81.50 would look like a Wave 1 peak of a 5-Wave uptrend. Initial support is near $77.55, a price that marks the 33% retracement level of Wave 1. The 50% retracement level is down near $71.10.
Corn (Cash): The DTN National Corn Index (NCI.X, national average cash price) closed at $3.26 1/4, down 43 cents for the month. The NCI.X fell right back into its major (long-term) sideways trend in June with resistance still at $4.10 and support near $3.23. Last month's sell-off created a bearish outside range on the monthly chart and saw the NCI.X settle near major support.
Soybean meal: The more active December contract closed at $401.00, up $4.40 on the continuous monthly chart. The major (long-term) trend remains up with the December contract holding above resistance at $400.30. This price marks the 50% retracement level of the previous downtrend from $541.80 (September 2012) through the low of $258.90 (February 2016). Given the bullish monthly stochastics, reflecting increased buying interest from noncommercial traders, and a bullish forward curve the market could extend its rally to the 67% retracement level of $447.60.
To track my thoughts on the markets throughout the day, follow me on Twitter: www.twitter.com\DarinNewsom


Comments
To comment, please Log In or Join our Community .