
Technically Speaking
Soybean Meal on the Run
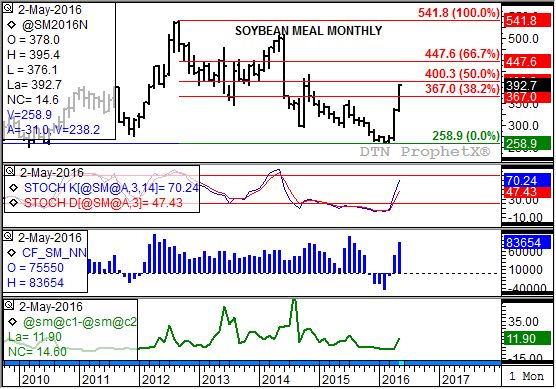
Since moving to its major (long-term) uptrend at the end of March 2016 (for more information, see the Monthly Analysis: Livestock Markets from April 1) the soybean mean market continues to flex its muscles. Strong buying continues to come from both commercial and noncommercial traders, so much so that the nearby July contract is quickly moving toward a test of major resistance at $400.30. This price marks the 50% retracement level of the previous downtrend from $541.80 (September 2012) through the low of $258.90 (February 2016).
How can we read what the different sides are doing? Easy enough. For noncommercial traders track the trend (price direction over time) of the futures market (top study). This usually tracks with the buying or selling being done by noncommercial traders, and shown in weekly CFTC Commitments of Traders reports (released Friday afternoons for positions held as of the previous Tuesday). A look at the blue histogram shows us this group has moved from a net-short futures position of -46,675 contracts toward the end of February to a net-long of 83,654 contracts as of Tuesday, May 17.
As for commercial interest, take a look at the bottom chart that tracks activity in the nearby futures spread (price difference between contracts). See that since late March/early April, after changing directions, the uptrend has accelerated to a close of an $11.90 inverse this Friday in the July-to-August spread. Not shown on this chart is the new-crop December-to-March spread that closed this past week (Friday, May 20) at an inverse of $15.90. This indicates the long-term commercial outlook is growing more bullish as well.
Given this, where might the futures market be headed? With the market's nearby futures spread showing a strong uptrend (strengthening inverse) again indicating an increasingly bullish commercial outlook, a 67% retracement of the previous downtrend is often seen. This puts the long-term target, barring a change in trend of the spread, at $447.60. However, there is a high from November 2014 at $417.60 that could cause the market to pause in its uptrend. Also, monthly stochastics (long-term momentum, second study) remain below the oversold level of 80%. This would indicate that the market still has room to run higher before buyers start to get nervous.
To track my thoughts on the markets throughout the day, follow me on Twitter:www.twitter.com\Darin Newsom
P[L1] D[0x0] M[300x250] OOP[F] ADUNIT[] T[]

Comments
To comment, please Log In or Join our Community .