
Technically Speaking
The USDX Rorschach Test
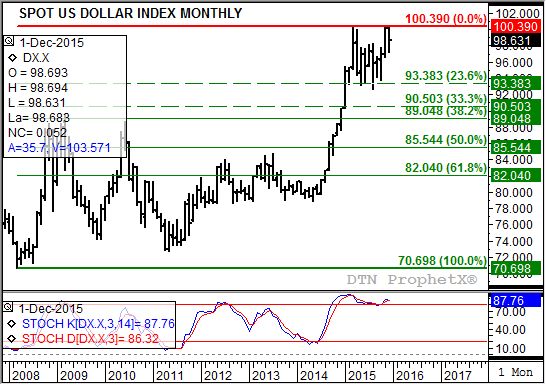
Forget the Rorschach test, to truly understand someone's market psychology all that is needed is an evaluation of the monthly chart for the U.S. dollar index (USDX). Those that want to be bullish commodities in 2016 will see a clear top formation on the USDX chart, while those believing the commodity sector is going to continue to fall see nothing bull bullish signals for the USDX.
Let's examine the two sides, starting with those bullish the USDX and bearish commodities. Key to this argument is that the USDX posted a high of 100.510 in December, above the peak of 100.310 from November and 100.390 from last March. By definition a trend that continues to post higher highs, without establishing a reversal, is considered up.
Furthermore, if you erase the noise of the bar chart, particularly the highs and lows, and focus only on monthly closes the major (long-term) uptrend becomes even clearer. November saw the USDX break out of the consolidation range between 98.357 and 94.600 on its monthly close chart, signaling a possible extension of its major uptrend to a target of 102.114 This target figure is arrived at by taking the previous sideways range of 3.757 (98.357 - 94.600) and adding it to the high side on a bullish breakout. It should also be noted that the 102.114 target falls in between technical targets of 101.737 and 104.110, the 61.8% and 67% retracement levels of the previous major downtrend from the high monthly close of 120.240 (January 2002) through the low monthly close of 71.802 (March 2008).
P[L1] D[0x0] M[300x250] OOP[F] ADUNIT[] T[]
Finally, widening the monthly close chart to show its previous downtrend (again dating back to 2002) shows a massive triangle bottom with the base formed by the high of 91.570 (November 2005) and the 71.802 low (March 2008). This base had a length of 19.768 and when attached to the subsequent bullish breakout of the triangle pattern, created by converging trendlines attaching the lower highs and higher lows, at 81.980 (August 2014) the upside target becomes 101.748. Again note that this would be in line with the previously mentioned breakout target and retracement levels.
The fundamental backing for a continued rally would be the expected gradual interest rate increases by the U.S. Federal Reserve as 2016 progresses. While the rally in the USDX leading up to the initial move by the Fed in December was impressive, commodity sector bearish are convinced the USDX will continue to power higher as further increases are seen.
"Buy the rumor, sell the fact" counter those who think commodities have been beaten about as far down as possible. They rely more on signals seen on the standard bar chart, including the new high posted in December. The fact the USDX wasn't able to hold near that high through its monthly close raises the discussion of a possible spike reversal following the establishment of a major double-top using the March 2015 high of 100.390 and the December peak of 100.510.
A sidenote here: USDX bulls might laugh at this analysis for a couple of points. First, the December high broke out the previous double-top formation between last March's 100.390 and November 100.310. In fact if we analyze this breakout using the interim low of 92.621 (August low), creating a range of 92.621, December's high would project a target just above 108.000. Also, the idea of a spike reversal can be countered by pointing out December's close of 98.631 was not near the monthly low, but nearly spot-on the mid-point of December's range at 98.850.
But back to the bearish USDX argument. Monthly stochastics established a bearish crossover (the faster moving blue line crossing below the slower moving red line) well above the oversold level of 80% in conjunction with the March 2015 high and close. As December came to an end monthly stochastics were back above 80%, setting the stage for a secondary (confirming) bearish crossover in the months ahead.
Those holding a bearish view also use the USDX's weekly chart to bolster their argument. There we see a bearish reversal the week of November 30 in conjunction with a bearish crossover by weekly stochastics above the overbought level of 80%. Additionally, the recent rally on the weekly chart amounts to a bearish flag, a consolidation pattern pointing to possible retest of secondary (intermediate-term) support between 93.316 and 92.257, the 33% and 38.2% retracement levels of the previous uptrend from 78.905 through the 100.510 high.
Bullish the USDX, bearish commodities; bullish commodities, bearish the USDX: The charts tell different people different things. All we know at the end is charts are more fun than ink blots and the results can be far less disturbing.
To track my thoughts on the markets throughout the day, follow me on Twitter:www.twitter.com\Darin Newsom

Comments
To comment, please Log In or Join our Community .