

Technically Speaking
Corn's Long-Term Support

Somehow we've already made it through half of 2014. It doesn't seem possible does it? But the annual end of June USDA report marks the midpoint of the year, with the second-half seemingly always moving faster than the first. Given we are now embarking on the downhill side, I'll spend the next few days looking at major (long-term) trends on monthly charts.
First up, and fittingly so, is corn. Monday's move lower had many laying the blame at the feet of the previously mentioned USDA Quarterly Stocks and Planted Acreage reports, but cooler heads realize that the market has been moving lower since the end of April, in conjunction with noncommercial traders (large global investment interests) moving their money out of the grain sector into other commodity sectors (e.g. energies, livestock).
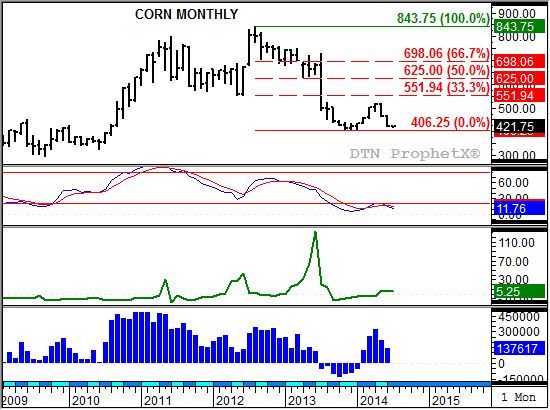
The latter point is shown in the bottom chart (blue histogram). Pulled from weekly CFTC Commitments of Traders reports, noncommercial traders held a net-long futures position of 322,349 contracts in late April. By the end of May that number had been reduced to 221,308 contracts, then down to 137,617 contracts in late June.
As a result of this selling, the nearby corn futures contract (top chart) has fallen from its April close of $5.14 (just off its high of $5.19) to the June settlement of $4.22 1/2. In sight now is the previous low of $4.06 1/4 posted in January 2014, with the question being is that price low enough to hold?
Evaluating the market, monthly stochastics (second study) were below the oversold level of 20% at the end of June. This normally leads to a bullish crossover, indicating a move to a major uptrend. However, it takes time. If noncommercial selling continues, possibly to the point of moving the futures position to a net-short (as seen from June 2013 through January 2014), then the futures market could slide to a new 2014 low and possibly test the area between $3.24 1/2 (low from June 2010) and the double-bottom near $2.90 (September 2009 and December 2008).
Fundamentally the market remains neutral, with the nearby July to September futures spread (third study, green line) priced near a 5-cent carry. The problem for corn is when the July contract expires, leaving the September to December spread and its 7-cent plus carry as nearby. From there the spread relationships get more bearish, with the December to March showing an 11 cent carry.
Corn needs to see support begin to build from commercial side of the market the market in order to establish a double-bottom formation with the January 2014 low. For that to happen, the market will need to grow more concerned about possible production problems in the face of continued solid demand. If summer weather becomes more beneficial, and demand projections for the 2014-2015 marketing year start to slowly erode, the market could be primed for a sell-off into the $3s.
P[L1] D[0x0] M[300x250] OOP[F] ADUNIT[] T[]
To track my thoughts on the markets throughout the day, follow me on Twitter: www.twitter.com\Darin Newsom
Commodity trading is very complicated and the risk of loss is substantial. The author does not engage in any commodity trading activity for his own account or for others. The information provided is general, and is NOT a substitute for your own independent business judgment or the advice of a registered Commodity Trading Adviser.
Comments
To comment, please Log In or Join our Community .