

Technically Speaking
Weekly Nov Beans Anything But Weak
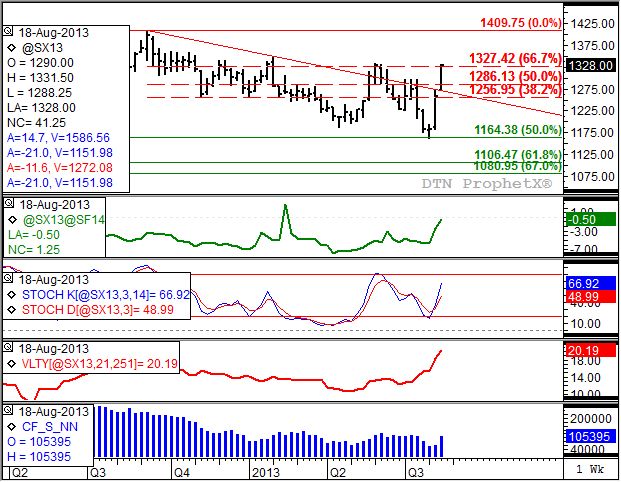
This past week was fascinating in November soybeans. If you look closely, very closely, at last week's price activity (top study) you will see the contract left a small bullish price gap between last week's high of $12.72 and this past week's low of $12.72 1/2. This actually occurred as last Sunday's CME Globex overnight session got under way, but received little notice.
As the week progressed, November beans seemed to gain bullish momentum. The weekly CFTC Commitments of Traders report indicates why. Noncommercial interests (investment traders, speculators, funds, etc.) increased their net-long futures position (bottom study, blue histogram) by about 44,500 contracts to 105,395 contracts as of Tuesday, August 20. Though the report doesn't show it, the uptrend on the daily chart and weekly chart indicates this activity likely continued through the end of the week.
P[L1] D[0x0] M[300x250] OOP[F] ADUNIT[] T[]
Why is this group of trader growing more interested in soybeans than, say, corn? The answer likely lies in the bullish long-term fundamentals of the market. Note that the November to January futures spread (second study, green line) saw its carry trimmed to 1/2 cent at Friday's close, and is poised to move into an inverse early next week. A look at the long-term forward curve chart (not shown) shows the soybean market is inverted throughout the balance of the 2013-2014 marketing year, or roughly from the January 2014 through the September 2014 futures contracts. This is a clear indicator that the commercial side of the market does not believe USDA's current ending stocks prognostication of 220 mb.
So what's next for November soybeans? This past Friday (August 23) saw the contract move above technical price resistance near $13.27 1/2, a price that marks the 67% retracement level of the previous downtrend from the high of $14.09 3/4 (week of September 9, 2012) through the recent low of $11.62 1/2 (week of August 4, 2013). Heading into what is expected to be a bullish week next week, November beans are in position to move above the previous peak of $13.33 (week of June 2, 2013) and possibly the high before that of $13.50 3/4 (week of February 3, 2013) when a bearish outside week was posted.
As discussed in the look at the monthly chart (Technically Speaking blog posted on August 19), the initial long-term price target near $13.71, though given the bullish commercial outlook a run to $14.75 or possibly $15.80 seems more likely. The latter targets mark the 50% and 67% retracements respectively of the previous major (long-term) downtrend from the September 2012 high of $17.89 (nearby soybean contract) through this month's low.
One thing that could possibly slow noncommercial buying interest is the increased market volatility (fourth study, red line). At Friday's close this was calculated at about 20.2%, higher than it was back in September 2012. Recall that noncommercial traders don't like highly volatile markets.
Unless.
Similar to Seuss' "The Lorax", there is a way noncommercial traders could go against their tendencies when it comes to volatility. And that is long-term fundamentals. If the forward curve continues to show a strong inverse, reflecting an ever-tightening supply and demand situation, this group should be willing to set aside their discomfort for volatility to ride the market until fundamentals begin to change. This change will most likely be noted with a bearish technical signal somewhere down the road. For now, November soybeans continue to show one of the more bullish market structures that I track.
To track my thoughts on the markets throughout the day, follow me on Twitter: www.twitter.com\DarinNewsom

Comments
To comment, please Log In or Join our Community .