

Technically Speaking
Dec Corn Daily Chart: At a Crossroads
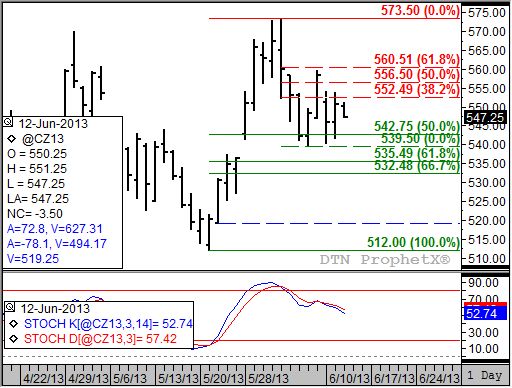
A look at the daily December corn chart shows a market that is unsure of its future direction. This opens the door for reaction to Wednesday's USDA June Crop Production report to set the trend of the market for the short-term. From a technical analysis point of view, this is a bitter pill to take since its main tenet is that fundamentals are already built into price.
Recall the posts on soybeans from last week. On Monday I discussed signals on the November weekly chart followed by Tuesday's look at the November daily. If you remember, the two charts showed two different trends in place, with the minor (daily) turning down while the secondary (weekly) holding in an uptrend. The same can be said for corn early Wednesday morning.
Daily stochastics (bottom study) shows December corn to be in a minor (short-term) downtrend. The contract has tested support at $5.42 3/4, a price that marks the 50% retracement level of the uptrend from $5.12 through the high of $5.73, four of the last five trading sessions. Yet, daily stochastics remain bearish with the last signal a bearish crossover (faster moving blue line crossing below the slower moving red line) on June 3, in conjunction with the key bearish reversal (the December contract traded above the previous day's high, below the previous day's low, and closed lower for the day) posted on the daily chart (upper chart).
P[L1] D[0x0] M[300x250] OOP[F] ADUNIT[] T[]
If signals on daily charts are to be believed, the reaction to Wednesday's report should be bearish. The contract is holding below resistance near $5.52 1/2, a price that marks the 38.2% retracement level of the initial selloff from $5.73 1/2 through the double-bottom low near $5.39 1/2. If a bearish breakdown is seen, a simple measuring device could indicate how far the contract might fall.
Using the double-bottom low near $5.39 1/2 (June 6 and June 10) and the interim high of $5.59 3/4 (June 7) gives us a range of 20 1/4 cents. Subtracting that from the low end of the range ($5.39 1/2) puts the target at $5.19 1/4, a price that is well below retracement support between $5.35 1/2 and $5.32 1/2 and equal to the low from May 22 (dashed blue line). On the other hand, a move above the previous high could set the stage for a rally to a new high of $5.80 ($5.59 3/4 plus the 20 1/4 cents).
The secondary (intermediate-term) weekly chart (not shown) indicates something different. The trend on the weekly chart for December corn remains up, with initial resistance near $5.70 1/2 and secondary resistance at $5.88 1/2. The latter would seem to be in line with the possible bullish breakout mentioned in the discussion of the daily chart.
Either way, the latter stages of Wednesday's session, post report, should prove to be interesting.
To track my thoughts on the markets throughout the day, follow me on Twitter: www.twitter.com\DarinNewsom

Comments
To comment, please Log In or Join our Community .