

Technically Speaking
Dec 13 Cotton: A Follow-Up

On February 21, 2012, this blog talked about the bullish outlook for the December 2013 (new-crop) cotton contract. Technically, the market looked to be establishing a solid uptrend supported by an increasingly bullish commercial view of supply and demand. Add in a bullish seasonal index and the conclusion was that the market could be testing the 89.00 range by mid-April.
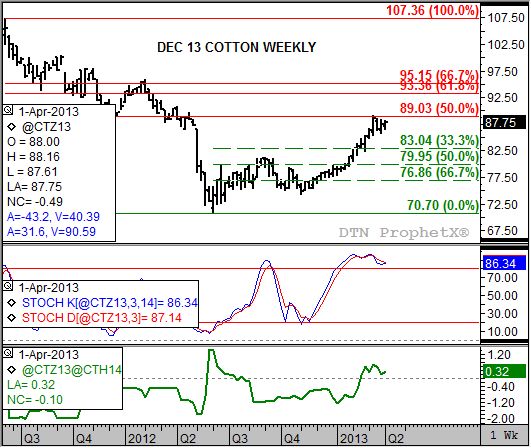
Fast forward to today. The Dec cotton contract has posted a series of highs near 89.00, with the highest being 89.20 the week of March 11. The consolidation phase the market has been in since on the weekly chart has market bulls concerned that a bearish change could be in process.
Weekly stochastics would seem to confirm that fear. Notice that the week after the contract posted its recent high, weekly stochastics (second study) established a bearish crossover with the faster moving blue line moving below the slower moving red line above the overbought level of 80%. Also notice that the December to March futures spread (bottom study, green line) has seen a slight weakening of its inverse, moving into a slight downtrend of its own.
P[L1] D[0x0] M[300x250] OOP[F] ADUNIT[] T[]
The latter is an interesting factor as it reflects a less bullish commercial outlook (supply and demand situation). Why would this be the case? The answer could lie in the still curious Prospective Plantings report from March 28. If indeed acres aren't going into corn and soybeans as earlier projected, then the argument could be made that cotton may not lose as much planted area as earlier estimated. Again, why? Possibly because it remains wet across much of the US Southeast, an area that was supposed to see increased corn and soybean plantings.
Back to technical indicators. The move by the Dec 13 contract is almost step for step with its five-year seasonal index. This study (not shown) shows the market tends to post its high the second week of April (next week), finishing off a 15% increase (weekly close only) from the first week of the previous December. This year the contract has gained 14% through Wednesday's close of 88.24 and the high weekly close of 88.51 (week of March 11).
The bottom line is this: the seasonal index would indicate there is little room time and space for the market to rally, on average, while the weekly chart of the Dec 13 contract itself shows a top may be forming leading to a seasonal downtrend. The index shows that the new-crop contract tends to fall 14% through late July, putting a possible weekly close low target near 76.12. The weekly chart shows possible support at the 33% retracement level of 83.04, the 50% retracement level of 79.95, and the 67% retracement level of 76.86. Combining the weekly study with the seasonal index would imply a 67% retracement could ultimately be seen. If so, the commercial outlook will have to grow far more bearish because at this point, the most the contract might fall would seem to be the 50% retracement level near 80.00.
To track my thoughts on the markets throughout the day, follow me on Twitter: www.twitter.com\DarinNewsom
Commodity trading is very complicated and the risk of loss is substantial. The author does not engage in any commodity trading activity for his own account or for others. The information provided is general, and is NOT a substitute for your own independent business judgment or the advice of a registered Commodity Trading Adviser.
Comments
To comment, please Log In or Join our Community .