

Technically Speaking
Lots to Talk About in May Corn
Watching the corn market develop this past week, I saw that the more active May contract was in the process of establishing a bullish reversal on its weekly chart. Sure enough, as soon as the market closed, colleague Elaine Kub tweeted that yes, such a signal had been put in place.
What is a bullish reversal? On the weekly chart, it occurs when a contract trades below its previous week low, above its previous week high, and closes higher for the week. In regards to the last characteristic, some analysts argue that the weekly close has to be above the previous week’s high.
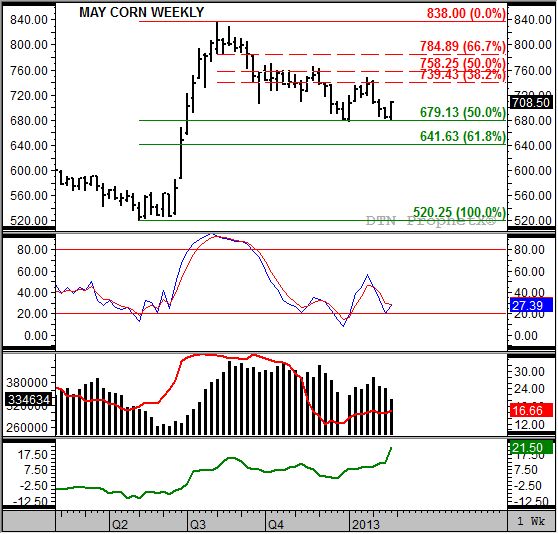
Take a look at the weekly chart for the May corn contract. The previous week’s range shows a high of $7.00 1/2, a low of $6.83 1/2, and a close of $6.84 1/4. This past week the contract posted a low of $6.80 3/4, a high of $7.09 3/4, before closing at $7.08 1/2. Notice that the close satisfies both views of what is necessary to establish a bullish reversal by closing above the previous week’s close and high.
Notice that I didn’t call this pattern a “key” bullish reversal. Take a closer look at the May weekly chart and you will see why. The week of January 7 the contract moved to a new low for its ongoing downtrend of $6.78 1/2, before rallying to a high that week of $7.19 1/2 before closing at $7.07. This was the key bullish reversal that signaled a longer-term change in trend. That makes this past week’s signal a secondary bullish reversal, confirming the previous signal.
Now let’s add in a few other factors. Again going back to the week of January 7, drop down to the second study – weekly stochastics – and notice that this same week saw a bullish crossover established with the faster moving blue line crossing above the slower moving red line, both below the oversold level of 20% (blue line at 19.5%, red line at 16.9%). This is also a confirming signal that the trend of the market had turned up.
P[L1] D[0x0] M[300x250] OOP[F] ADUNIT[] T[]
What did the May contract do after the key bullish reversal was posted in January? The initial move saw the contract rally to a high of $7.47 1/2 and a high weekly close of $7.37 3/4. As the chart shows, this was a test of the 38.2% (Fibonacci) retracement of the downtrend from the high of $8.38 posted in early August (when stochastics established a bearish crossover) through the low the week of January 7. A sidenote, this low was a test of the longer-term 50% retracement level of the uptrend from the contract low of $5.20 1/4 through the contract high of $8.38.
That’s a lot of numbers, I know. Take a break, get a cup of coffee, and I’ll meet you back here in a couple of minutes.
Okay, welcome back. So far we’ve established that the May corn market has posted a key bullish reversal in January and a secondary bullish reversal this past week. Weekly stochastics confirm these moves, and the May contract has tested both resistance and support levels over the last couple of months. Now what?
For the corn market in general to move into its seasonal uptrend (not shown, but usually rallying 25% from its winter low through its early July high), increased noncommercial (speculative, investment, fund, etc.) buying interest will need to be seen. The noncommercial long futures position reported in weekly CFTC Commitments of Traders report is shown in the third study, black histogram. Note that this position has been generally decreasing since August 2012, and reported at about 334,600 contracts this past Friday (positions as of Tuesday, February 26). Again, that position is as of Tuesday, when the May contract was moving below last week’s low. The rally at the end of the week implies that this group was likely buying, meaning next Friday’s report could show an increase.
Why would investment money look to come back to the corn market? To begin with market volatility (red line, same third study) remains low at about 16.7%. In contrast, notice that back in August 2012 when investors started leaving the market, volatility was just over 35%. Investors don’t like high volatility, but will start to buy low volatility if another key component of the market exists.
And that, last but not least, is bullish fundamentals. Investors like to put money into a market that not only has low volatility, limiting risk, but bullish fundamentals that provide support. Take a look at the bottom study, the trend of the May to July futures spread (green line). The strong uptrend reflects a strengthening inverse, closing at 21 1/2 cents this past Friday. This reflects an increasingly bullish market view of fundamentals meaning commercial traders are growing more concerned about sourcing supplies to meet demand this spring and summer.
Putting it all together: a market that has bullish futures spreads tends to see at least a 50% retracement of its previous downtrend, putting an initial target at $7.58 1/2. However the more bullish the futures spread is (market’s view of fundamentals) the larger the possible retracement putting the next target up at the 67% level (Dow Theory) near $7.85. If we use the five-year seasonal index as a guide (remember, a 25% rally from low weekly close in the winter to high weekly close in the summer) the target price jumps to near $8.50, or a test of the all-time high of $8.43 3/4 on the continuous monthly chart posted in you August 2012.
To track my thoughts on the markets throughout the day, follow me on Twitter: www.twitter.com\DarinNewsom
Commodity trading is very complicated and the risk of loss is substantial. The author does not engage in any commodity trading activity for his own account or for others. The information provided is general, and is NOT a substitute for your own independent business judgment or the advice of a registered Commodity Trading Adviser.

Comments
To comment, please Log In or Join our Community .