
Fundamentally Speaking
Largest Soybean Stocks, Large Carry Market

Due to the government shutdown, the monthly World Agricultural Supply Demand Estimates (WASDE) report slated to be released on January 11 has been postponed.
This did not prevent the various wire services from collecting estimates for this and other USDA reports that scheduled for release that day.
With regard to the expected 2018/19 U.S. soybean ending stock figure the average of the estimates was 904 million bushels (mb) which is down from the last USDA projection of 955 mb.
That figure is the highest U.S. carryout ever exceeding the prior high of 574 mb in the 2006/07 season though this year's 23.2% stocks-to-use ratio is the second highest ever, topped only by the 28.5% ratio seen back in the 1985/86 marketing year.
P[L1] D[0x0] M[300x250] OOP[F] ADUNIT[] T[]
The fact that we are so swamped with soybeans has resulted in the often-cited July-November soybean spread being in a carry (where the new crop November is higher priced than the old crop July -- an indicator of ample supplies).
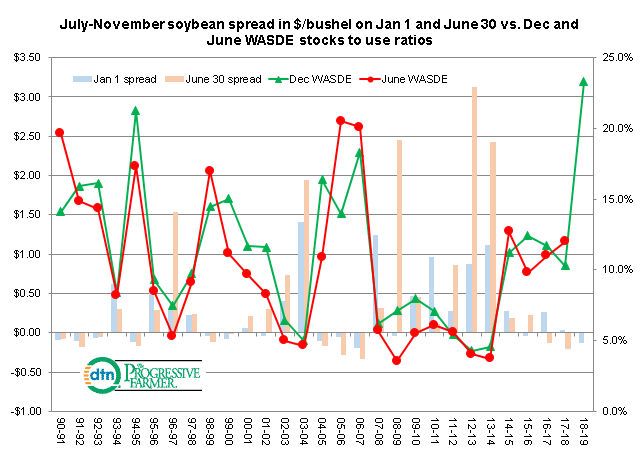
This graphic shows the July-November soybean spread at two points in time for the same marketing year that starts September 1 and goes to the following August 31.
The first is at the start of the new year January 1 or the first business day of the year and then for June 30, right before the July contract goes into its delivery period plotted in dollars per bushel.
We plot these price points against the stocks- to-use ratio reported in the December and then following June WASDE reports.
As a general rule, the lower the stocks-to-use ratio the more inverted the spread is (July over November) and conversely the looser the ratio the more often the market is in a carry.
As noted, the December 2018 WASDE report pegged the 2018/19 soybean stocks-to-use ratio at a huge 23.2% and on 1/2/19 the July 2019 soybean futures were trading 12 1/2 cents below the November 2019 contract.
This is the largest carry in December since December 2006 when the 2006/07 stocks-to-use ratio was also a very high 18.3% with the SN2007/SX2007 spread was 20 cents under.
Going forward, there are many who feel that the last ending stocks estimate of 955 mb will be the high water market, especially if the USDA lowers the 2018 national soybean yield as expected and positive U.S.-China trade talks result in increased sales of U.S. soybeans to the PRC.
In that case, we expect a lower stocks-to-use ratio will translate into a tighter SN2019/SX2019 spread by June 30, 2019.
(KA)
Comments
To comment, please Log In or Join our Community .