

Fundamentally Speaking
History Suggests Increases in 2018 U.S. Soybean Yield

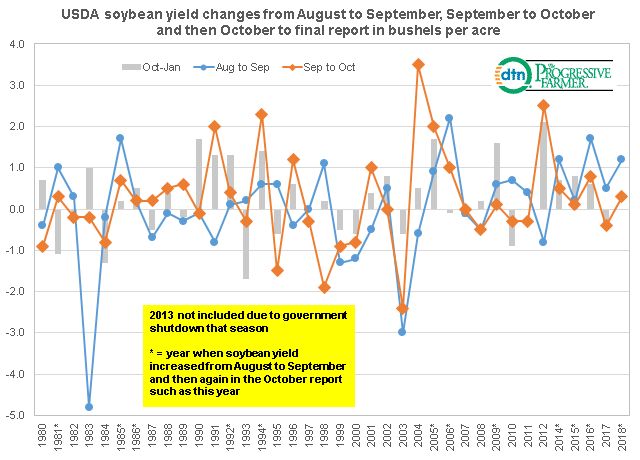
Similar to what we did with corn, this graphic shows the USDA soybean yield changes from August to September, September to October and then October to final report in bushels per acre.
A budget-imposed government shutdown in 2013 that resulted in no October 2013 USDA reports being released led to the exclusion of that year.
Just focusing on those years where the USDA's soybean yield increased from the August to the September report and then increased again in the October report, there are 12 years since 1980 that this has happened including this season.
Of the 11 past years, only twice has the final yield been lower than the October USDA estimate, 1981 when it was 1.1 bushels per acre (bpa) down from October and 2006 when it was a mere 0.1 bpa off.
The other nine years, including three straight from 2014 to 2016, showed yield increases ranging from 0.2 bpa in 1985 to a more sizable 1.7 bpa increase in 2005 with an average 0.7 bpa increase.
History does suggest that further yield increases are in the cards but this may not be the case this season as the trade is worried about a large part of the nation's soybean crop, especially in the Midwest and Southeast, that may have been damaged from heavy rains due to ongoing precipitation and recent hurricanes down south.
Reports indicate that sprouting, splitting and mold issues are rather commonplace so in addition to quality deterioration there may also be quantity losses.
(KA)
P[L1] D[0x0] M[300x250] OOP[F] ADUNIT[] T[]
Comments
To comment, please Log In or Join our Community .