
Fundamentally Speaking
Influence on Corn Yields
The USDA is in the process of putting together its estimates for the August 10th crop production report.
This is a two-step process where the USDA has personnel out in the fields doing their own quantitative measurements supplemented by farmer assessments of their crops.
In the case of corn, the yield per acre figures are based on the number of plants per acre, the number of ears per plant which usually comes out to one and then the average weight of each ear.
The actual field surveys are done in the ten largest producing states with the aggregate figures then extrapolated to arrive at a national figure.
P[L1] D[0x0] M[300x250] OOP[F] ADUNIT[] T[]
The corn crop is still developing when the August survey period is happening with some of the fields in more northern locales still in the midst of its key pollination period.
For that reason the USDA often uses their plant per acre figures and then the five year average ear weight.
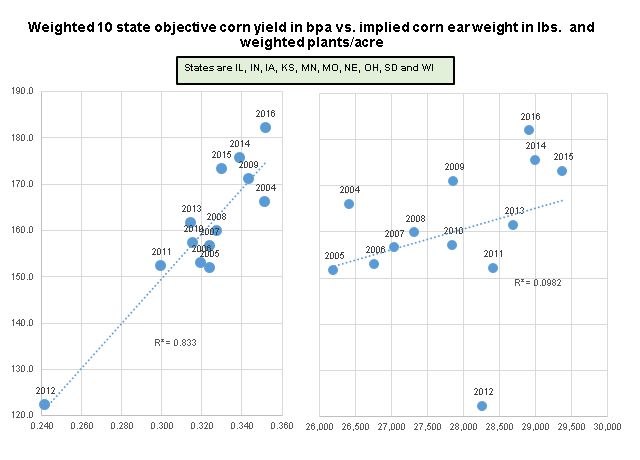
This two part graphic shows the weighted ten objective state yield in bushels per acre going up and down the y-axis for both charts with the one on the left plotting the implied corn ear weight in pounds per ear and on the right the average weighed plants per acre on the x-axis respectively.
As we have noted a number of times in the past, the number of plants per acre has continued to increase over time as enhanced seed genetics and narrower planting rows have allowed famers to shoehorn in more plants per given area over time.
For instance in Illinois, the number of ears per acre was 24,200 in 1996 increasing to 28,000 by 2006 and then up to 31,100 last year.
The average 10 state ear population has increased from 26,400 in 2004 to 28,930 in 2016 and this really accounts for the steady increase in yields, known as trend yields where corn yields have increased by about 1.80 bushels per year for the past number of years.
Note that plant populations explain less than 10% of yield variability whereas the average ear weight explains over 83% of the 10 state objective yield variability.
This because ear weights are highly influenced by weather conditions, specifically temperatures and precipitation and how they impact the number of rows per ear, the number of kernels around a row and how large the individual kernels get to be.
Note the years of record national yields such as 2004, 2009, 2014 and 2016 have heavier than normal ears that can be attributed to reasonable temperatures and ample precipitation, especially during the key month of July.
(KA)

Comments
To comment, please Log In or Join our Community .