

Fundamentally Speaking
Kansas Wheat Protein Percent & Drought
We have mentioned that the ongoing drought in the Northern Plains has intensified with areas of what is now severe drought in sections of the Dakotas.
This has first impacted potential production of hard red spring wheat, a major crop grown in that area of the country.
The USDA reported that as of the middle of June only 45% of the crop is rated either in the good or excellent categories, the second worst national rating for this time of year going back to 1986.
Due to a second year in a row of low protein winter wheat, there was going to be big demand anyways for the higher protein spring wheat for blending purposes among millers but production prospects for that variety is deteriorating.
The problem is for the second year in a row, the Kansas hard red winter wheat crop will have lower than normal protein levels based on rather wet conditions this spring that may accentuate yields but has a depressing impact on protein levels.
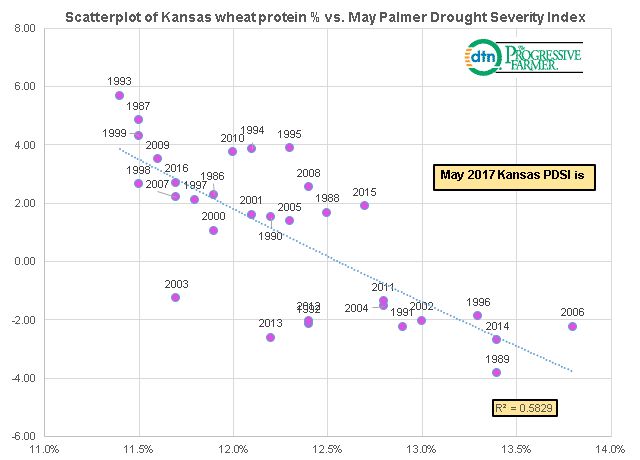
It seems as if a dearth of rain leading to crop stress that harms yields actually enhances protein levels. Work we have done indicates that drought conditions in Kansas have a decent positive correlation with that states wheat protein percent to the tune of about 78%.
Taking that further we present a scatterplot graph of the annual protein percent of the Kansas wheat crop vs. the May reading of that states Palmer Drought Severity Index (PDSI).
According to the National Climatic Data Center This is the monthly value (index) that is generated indicating the severity of a wet or dry spell.
This index is based on the principles of a balance between moisture supply and demand.
Man-made changes were not considered in this calculation.
The index generally ranges from -6 to +6, with negative values denoting dry spells and positive values indicating wet spells.
There are a few values in the magnitude of +7 or -7. PDSI values 0 to -.5 normal; -0.5 to -1.0 = incipient drought; -1.0 to -2.0 = mild drought; -2.0 to -3.0 = moderate drought; -3.0 to -4.0 = severe drought; and greater than -4.0 = extreme drought.
Note that years in which the protein content of Kansas wheat was highest were in years of moderate to extreme drought such as 1989, 2014 and 2006.
Conversely, some of the worse protein yielding seasons coincided with years of very saturated soil conditions including 1993, 1987 and 1989 when yields were actually quite good.
It appears that May PDSI readings explain about 58% of the variability in the protein content of Kansas wheat.
(KA)
P[L1] D[0x0] M[300x250] OOP[F] ADUNIT[] T[]

Comments
To comment, please Log In or Join our Community .