
Fundamentally Speaking
Initial Soybean Crop Rating & Impact on Final Yields
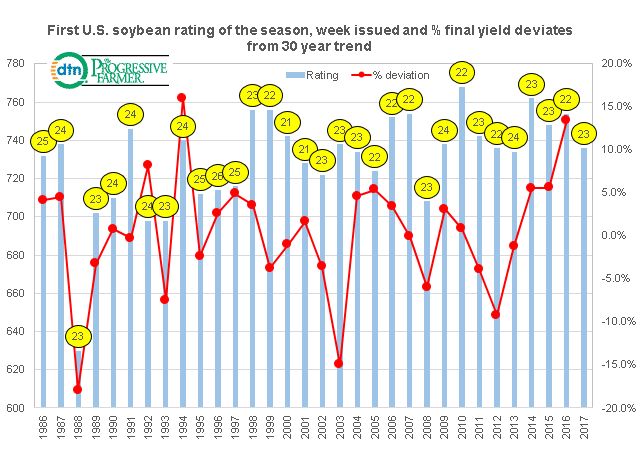
The USDA released its first weekly crop condition report for U.S. soybeans this week and the initial ratings are the second lowest of the past ten years.
Using our usual ratings system (where we weight the crop based on the percent in each category and assign that category a factor of 2 for very poor, 4 for poor, 6 for fair, 8 for good, and 10 for excellent and then sum the results), the first soybean crop rating this year was 736 vs. 754 a year ago and also below the five, ten-year and 15-year averages which are 747, 744 and 741 respectively.
Similar to what we did with corn, this graphic shows the initial crop ratings along with the percent that the final U.S. soybean yield deviated from the 30-year trend.
P[L1] D[0x0] M[300x250] OOP[F] ADUNIT[] T[]
We also added the date that the first crop report of the year was issued to help gauge whether an early release perhaps presaged a good yield or conversely a late release was related to a below trend yield.
The highest initial crop rating was in 2010 at 768 though final yields that year were a mere 0.1% above trend with the next highest first crop rating of the season at 762 in 2014 with yields 5.6% above trend. 1998 and 1999 were next at 756 with final yields up 3.6% and down 3.7% from trend respectively.
On the other hand, we have seen some years such as 1992 where a low first crop rating proved no hindrance to good yields with a record final yield being posted that season.
Note that in 2013, an initial rating of 734 saw final yields that year 1.2% below trend while the previous year with a rating of 736 saw final yields 9.2% below trend though that was the serious drought season of 2012.
Obviously the first week of June is a long way removed from when the actual crop is made but having a favorable initial crop rating for soybeans may put it in better shape for final yields as the correlation between the initial crop rating for soybeans and the percent that final yields deviate from the 30-year tend is 46.2% vs. 31.0% for corn.
Keep in mind that the U.S. has produced three record national soybean yields in a row.
(KA)

Comments
To comment, please Log In or Join our Community .