
Fundamentally Speaking
Actual US Soybean Yields
As expected, the USDA issued a rather conservative yield forecast for the 2017 U.S. soybean crop coming in at 48.0 bushels per acre (bpa), down 4.1 from the year ago record.
This forecast is based on a weather-adjusted trend model using data from the period 1988-2016, similar to the one they use for corn.
We should note that the USDA's record 2017 planted acreage forecast at 88.0 million which is 4.6 million above the final 2016 seedings may also be responsible for suppressing their yield forecasts to some extent given that some less than top ground may be moved into production.
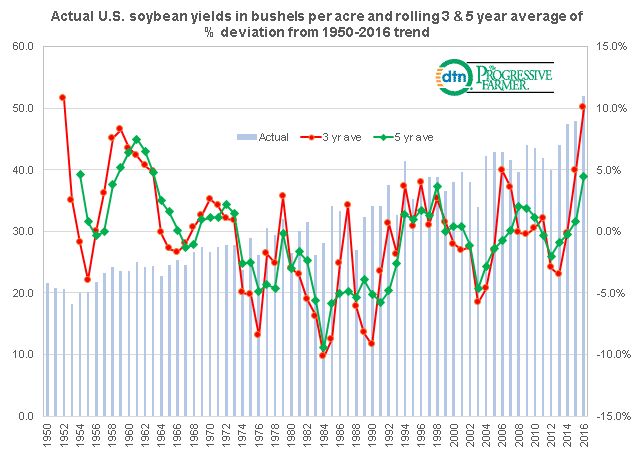
The attached graphic shows the actual U.S. soybean yields in bushels per acre (bpa) from 1950-2016 on the left hand axis while the right hand axis is the rolling three year and five year average of the percent that these actual soybean yields deviated from the 1950-2016 trend.
Coming off the 2012 drought, the 2013 U.S. soybean yield was 44.0 bpa, which was about equal to the trend yield that year of 43.9 bpa.
Actual yields the next three years were 47.5, 48.0 and 52.1 bpa, which respectively were 7.2%, 7.4% and 15.5% above trend for a three-year average of 10.0% and this appears to be the highest three-year average since 10.8% in 1952.
The five-year average however still incorporates the 2012 yield of 40.0 bpa yield which was surprisingly only 8.0% below the 1950-2016 trend resulting in the five year rolling average of 4.2% above trend which as the chart notes other than last year is the highest since 1963.
(KA)
P[L1] D[0x0] M[300x250] OOP[F] ADUNIT[] T[]

Comments
To comment, please Log In or Join our Community .