

Fundamentally Speaking
Actual US Corn Yields

A little early to start talking about the impact of weather on U.S. crops other than wheat where ongoing drought conditions has resulted in subpar crop ratings though good spring rains can easily compensate for fall-winter dryness.
Perhaps a bigger concern has been the extended period of above normal temperatures in areas of the Central and Southern Plains that has caused some of the hard red winter wheat crop to come out dormancy early.
This will not only increase the plant's moisture needs but make it vulnerable to a freeze which is entirely possible given that it's early March.
P[L1] D[0x0] M[300x250] OOP[F] ADUNIT[] T[]
On a related note, most of the U.S. summer weather forecasts we have seen taken of course with a large grain of salt have been rather benign with no fears of an emerging La Nina that had the markets on edge a year ago.
We should mention that since the horrific 2012 drought, U.S. row crop yields have been very good with record corn yields two of the past three seasons and three all-time high soybean yields in a row.
There is concern that this string of good fortune may come to an end, though in the case of corn, having three above trend yields in a row is not out of the ordinary.
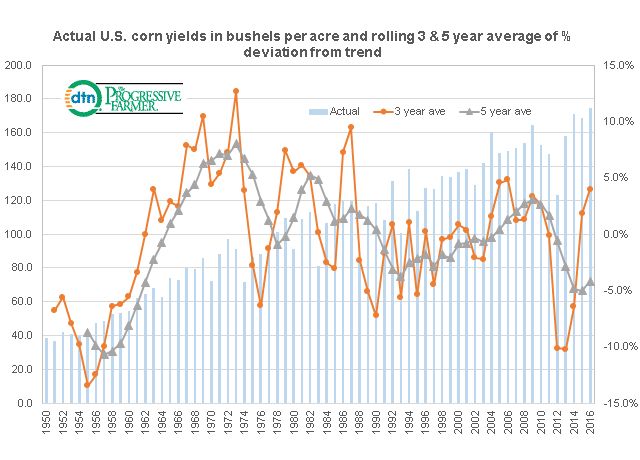
The attached graphic shows the actual U.S. corn yields in bushels per acre (bpa) from 1950-2016 on the left hand axis while the right hand axis is the rolling three year and five year average of the percent that these actual corn yields deviated from the 1950-2016 trend.
Coming off the 2012 drought, the 2013 U.S. corn yield was 158.1 bpa which was 1.8% below the trend yield that year of 160.9 bpa.
Actual yields the next three years were 171.0, 168.4 and 174.6, which respectively were 5.0%, 2.2% and 4.7% above trend for a three-year average of 4.0%. This appears to be the highest three-year average since 4.8% in 2006 and 4.6% the year before that and prior to those two years, one would have to go back to the 1987 to see a higher three-year rolling average.
The five year average however still incorporates the 2012 yield of 123.1 bpa yield which was a whopping 22.6% below the 1950-2016 trend resulting in the five year rolling average of -4.2% which, as the chart notes, other than last year is the lowest since 1962.
(KA)
Comments
To comment, please Log In or Join our Community .